
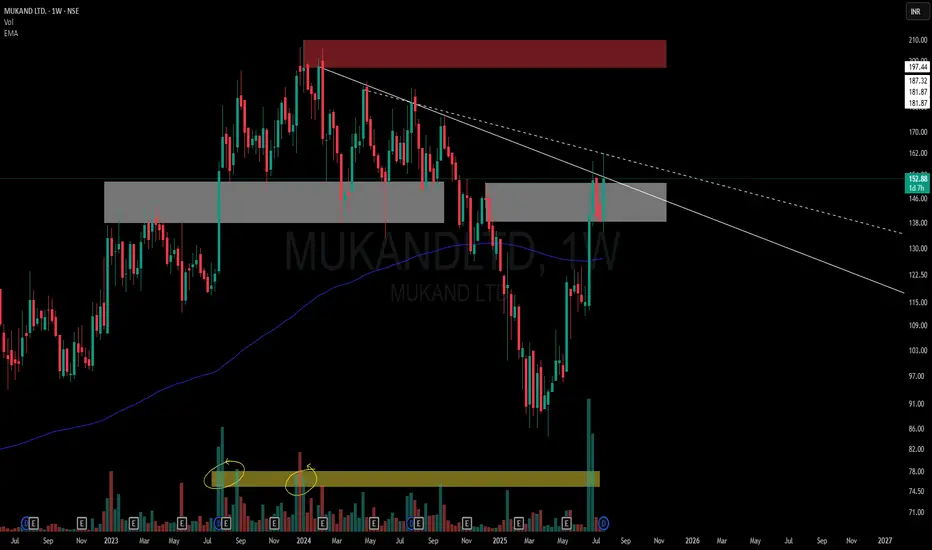
This chart is a visual case study of how price behaves when historic supply meets structural compression.
📌 Structural Highlights:
⚪ Primary Descending Trendline – Clean and persistent resistance from the top, still unbroken in a meaningful way.
▫️ Secondary Dotted Trendline – Shorter-term descending pressure also in play, giving us a dual resistance dynamic.
🟫 Strong Overhead Supply – Marked in red, this zone has held significance multiple times in the past.
⚪ Active Flip Zone – A broad grey zone showing a role reversal from supply to demand, currently interacting with price again.
📊 Volume Belt:
-Highlighted Yellow Volume Belt at the bottom shows repeated heavy interest.
🧠 Not a call – Just a neutral lens on structural context and how the market respects its own footprints.
📌 Structural Highlights:
⚪ Primary Descending Trendline – Clean and persistent resistance from the top, still unbroken in a meaningful way.
▫️ Secondary Dotted Trendline – Shorter-term descending pressure also in play, giving us a dual resistance dynamic.
🟫 Strong Overhead Supply – Marked in red, this zone has held significance multiple times in the past.
⚪ Active Flip Zone – A broad grey zone showing a role reversal from supply to demand, currently interacting with price again.
📊 Volume Belt:
-Highlighted Yellow Volume Belt at the bottom shows repeated heavy interest.
🧠 Not a call – Just a neutral lens on structural context and how the market respects its own footprints.

🎁 Get 1–2 free swing picks/month on Telegram:
t.me/hashtaghammer
📲 Enquire about stock recommendation services - WhatsApp “Hi”
wa.me/919455664601
Apoorv Dubey | SEBI RA | INH000030287
t.me/hashtaghammer
📲 Enquire about stock recommendation services - WhatsApp “Hi”
wa.me/919455664601
Apoorv Dubey | SEBI RA | INH000030287
関連の投稿
免責事項
これらの情報および投稿は、TradingViewが提供または承認する金融、投資、取引、またはその他の種類の助言もしくは推奨であることを意図したものではなく、またこれらに該当するものでもありません。詳細は利用規約をご覧ください。
🎁 Get 1–2 free swing picks/month on Telegram:
t.me/hashtaghammer
📲 Enquire about stock recommendation services - WhatsApp “Hi”
wa.me/919455664601
Apoorv Dubey | SEBI RA | INH000030287
t.me/hashtaghammer
📲 Enquire about stock recommendation services - WhatsApp “Hi”
wa.me/919455664601
Apoorv Dubey | SEBI RA | INH000030287
関連の投稿
免責事項
これらの情報および投稿は、TradingViewが提供または承認する金融、投資、取引、またはその他の種類の助言もしくは推奨であることを意図したものではなく、またこれらに該当するものでもありません。詳細は利用規約をご覧ください。