
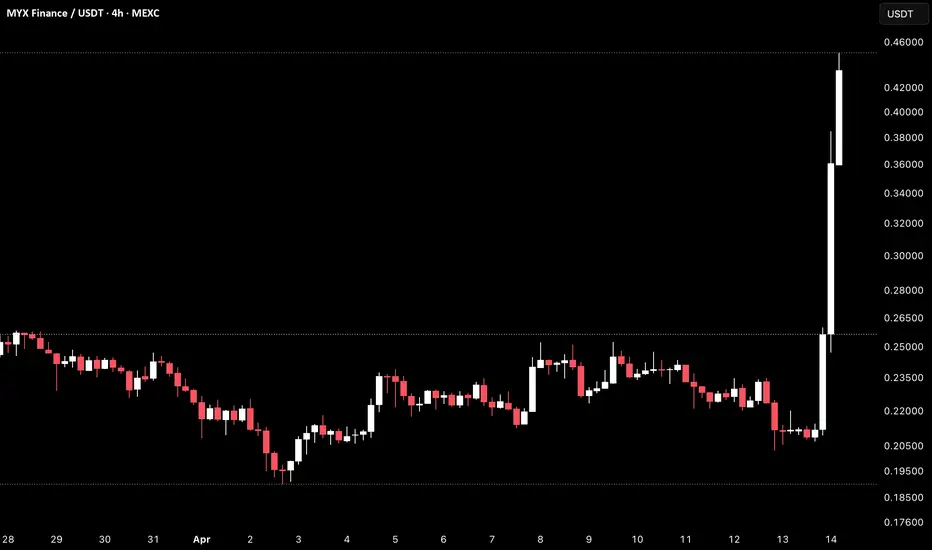
MYX Finance on the 4H timeframe is currently trading around 0.4102 after an explosive vertical move that sent price from the 0.210 region all the way to a high near 0.440+ in a single candle.
Price has since retraced sharply and is now hovering near the 0.410 area, still well above the prior range but showing signs of cooling after the initial impulse.
The entire move happened after weeks of tight consolidation between 0.200 and 0.255.
Key Levels To Watch
0.440+ → Spike high, key resistance above
0.410 → Current price, immediate reaction zone
0.255–0.260 → Prior range highs, now first major support below
0.210–0.220 → Base of the consolidation range
Below 0.200 → Full structure breakdown
The key question now is whether price can hold above the prior range highs near 0.255–0.260 on any pullback, which would confirm the breakout as legitimate.
A clean hold above 0.255 would keep the bullish breakout structure intact and open room for continuation.
A full retrace back below 0.255 would suggest the spike was a liquidity event and not a structural breakout.
This is a post-spike decision point.
Hold 0.255 on pullback → breakout confirmed, continuation possible.
Lose 0.255 → spike fades back into the prior range.
No bias until price stabilizes and reaction zones are confirmed.
Price has since retraced sharply and is now hovering near the 0.410 area, still well above the prior range but showing signs of cooling after the initial impulse.
The entire move happened after weeks of tight consolidation between 0.200 and 0.255.
Key Levels To Watch
0.440+ → Spike high, key resistance above
0.410 → Current price, immediate reaction zone
0.255–0.260 → Prior range highs, now first major support below
0.210–0.220 → Base of the consolidation range
Below 0.200 → Full structure breakdown
The key question now is whether price can hold above the prior range highs near 0.255–0.260 on any pullback, which would confirm the breakout as legitimate.
A clean hold above 0.255 would keep the bullish breakout structure intact and open room for continuation.
A full retrace back below 0.255 would suggest the spike was a liquidity event and not a structural breakout.
This is a post-spike decision point.
Hold 0.255 on pullback → breakout confirmed, continuation possible.
Lose 0.255 → spike fades back into the prior range.
No bias until price stabilizes and reaction zones are confirmed.

免責事項
これらの情報および投稿は、TradingViewが提供または承認する金融、投資、取引、またはその他の種類の助言もしくは推奨であることを意図したものではなく、またこれらに該当するものでもありません。詳細は利用規約をご覧ください。
免責事項
これらの情報および投稿は、TradingViewが提供または承認する金融、投資、取引、またはその他の種類の助言もしくは推奨であることを意図したものではなく、またこれらに該当するものでもありません。詳細は利用規約をご覧ください。