
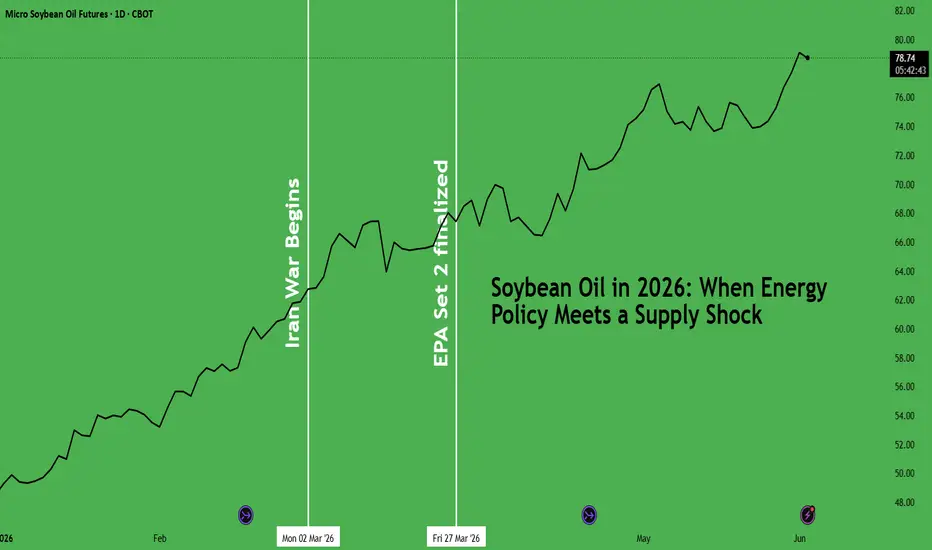
Soybean oil is up 62.6% year-to-date in 2026. Soybean oil is an agricultural commodity derived from soybeans. It is widely used in cooking, food processing, and as an industrial input. But the Soybean Oil story is now dominated by biodiesel as increasing quantities of the edible oil are redirected towards energy.
This paper delves into Soybean Oil’s energy story with historical examples of how these cycles usually play out.
Soybean Oil and Energy
When crude rises, conventional diesel becomes expensive, and biodiesel becomes relatively attractive. Leading refiners towards higher substitution quantities, especially during supply shocks.
That demand is further anchored by the U.S. Renewable Fuel Standard (RFS). The RFS legally mandates a minimum annual volume of biomass-based diesel. This creates a demand floor for soybean oil that is independent of crude prices or food demand.
The U.S. Environmental Protection Agency (EPA)’s “Set 2” rule, finalised in March 2026, raised that mandate by 61% in a single step, from 3.35 billion gallons (2025) to 5.4 billion gallons (2026).

Source: EPA
The downstream effect is captured in the USDA May 2026 WASDE. In the 2024/25 crop year, biofuels accounted for 43.7% of all U.S. soybean oil consumed domestically. By 2026/27, that share is projected to reach 54.4%. Over half of domestic soybean oil is now used for energy.

Source: USDA (WASDE), May 2026
Soybean Oil is a More Resilient Energy Bet

The rolling 20-day correlation between ZL (Soybean Oil Futures) and CL (Crude Oil Futures) peaked near 1.0 in late March, when the Hormuz disruption and the EPA Set 2 announcement landed within days of each other. By April, crude sold off sharply on ceasefire news. Soybean oil not only held but continued to advance. Correlation collapsed toward zero. At 0.28, the two are now trading independently.
Crude has since retraced further, yet soybean oil has held its gains. In other words, policy is driving ZL, not crude prices.
Technical Signals

Price holds above all MAs following a 9/21 bullish crossover. R1 at 79.74 is the next test; a break opens R2 at 81.75.

MACD has crossed back above its signal line, signalling renewed momentum. RSI at 70 is approaching overbought but remains below the prior peak of 80, leaving room to run.

Source: CME CVOL
Implied volatility spiked on the Hormuz shock, then collapsed as price extended. The market is not pricing in downside risk. IV is now near YTD lows while price sits at YTD highs. The minor recovery in recent days is worth watching.
Managed Money has started to cut back net long after a historic buildup:

Managed money entered 2026 deeply net short at -70K contracts, then flipped aggressively as the Hormuz shock and EPA Set 2 hit simultaneously. Positioning peaked at 170K net longs in the week ending May 5 before profit-taking set in. At 141K, longs are trimming but not exiting.
Historical Trade Setup
Russia-Ukraine Supply Shock — February 2022
Russia’s invasion of Ukraine on February 24, 2022 triggered an acute global vegetable oil supply shock. Sunflower oil exports from the Black Sea collapsed, driving demand rotation aggressively into soybean oil. A tactical long on ZLH22 (Soybean Oil Futures, March 2022) captured the ensuing rally.

CME Micro Soybean Oil Futures (MZL) were launched on February 24, 2025 and were not available during the 2022 period. The trade below uses micro contract sizing for illustration.
Long CME Micro Soybean Oil Futures, MZL (Illustrative Equivalent)
This trade would have yielded a net gain of 25.3%.
EPA RFS Set 1 Mandate Announcement — June 2023
The EPA’s finalised RFS “Set 1” rule on June 21, 2023, raised the biomass-based diesel mandate to 2.82 billion gallons, lifting soybean oil prices as feedstock demand rose sharply. Despite an initial sell-the-news reaction on the day, the market grasped the scale of the demand shift and bid aggressively over the following weeks.

CME Micro Soybean Oil Futures (MZL) were launched on February 24, 2025 and were not available during the June 2023 period. The trade below uses micro contract sizing for illustration.
Long CME Micro Soybean Oil Futures, MZL (Illustrative Equivalent)
This trade would have yielded a net gain of 19.4%.
In 2026, both types of catalysts are active simultaneously. The Hormuz closure brought the energy supply shock; the EPA Set 2 rule brought the demand mandate. Historically, either driver on its own has been enough to move soybean oil prices sharply. The current setup compounds them.

The ZL/ZM ratio measures soybean oil's price relative to soybean meal. Both come from the same crush process, but only soybean oil carries the biodiesel demand channel, which is what has driven the premium to current levels.
At 0.24, the ratio has moved above every level recorded in the past five years, including the Russia-Ukraine high of 0.20. In every prior instance, a spike of this magnitude was followed by compression. The EPA Set 2 mandate complicates the picture somewhat: it has raised the structural demand floor for soybean oil in a way prior cycles did not, so any reversion may be shallower than history alone would suggest. That said, at current levels, ZM is the leg most likely to recover relative ground.
This content is sponsored.
MARKET DATA
CME Real-time Market Data helps identify trading setups and more effectively express market views. If you have futures in your trading portfolio, you can check out on CME Group data plans available that suit your trading needs at tradingview.com/cme.
DISCLAIMER
This case study is for educational purposes only and does not constitute investment recommendations or advice. Nor are they used to promote any specific products, or services.
Trading or investment ideas cited here are for illustration only, as an integral part of a case study to demonstrate the fundamental concepts in risk management or trading under the market scenarios being discussed.
This paper delves into Soybean Oil’s energy story with historical examples of how these cycles usually play out.
Soybean Oil and Energy
When crude rises, conventional diesel becomes expensive, and biodiesel becomes relatively attractive. Leading refiners towards higher substitution quantities, especially during supply shocks.
That demand is further anchored by the U.S. Renewable Fuel Standard (RFS). The RFS legally mandates a minimum annual volume of biomass-based diesel. This creates a demand floor for soybean oil that is independent of crude prices or food demand.
The U.S. Environmental Protection Agency (EPA)’s “Set 2” rule, finalised in March 2026, raised that mandate by 61% in a single step, from 3.35 billion gallons (2025) to 5.4 billion gallons (2026).
Source: EPA
The downstream effect is captured in the USDA May 2026 WASDE. In the 2024/25 crop year, biofuels accounted for 43.7% of all U.S. soybean oil consumed domestically. By 2026/27, that share is projected to reach 54.4%. Over half of domestic soybean oil is now used for energy.
Source: USDA (WASDE), May 2026
Soybean Oil is a More Resilient Energy Bet
The rolling 20-day correlation between ZL (Soybean Oil Futures) and CL (Crude Oil Futures) peaked near 1.0 in late March, when the Hormuz disruption and the EPA Set 2 announcement landed within days of each other. By April, crude sold off sharply on ceasefire news. Soybean oil not only held but continued to advance. Correlation collapsed toward zero. At 0.28, the two are now trading independently.
Crude has since retraced further, yet soybean oil has held its gains. In other words, policy is driving ZL, not crude prices.
Technical Signals
Price holds above all MAs following a 9/21 bullish crossover. R1 at 79.74 is the next test; a break opens R2 at 81.75.
MACD has crossed back above its signal line, signalling renewed momentum. RSI at 70 is approaching overbought but remains below the prior peak of 80, leaving room to run.
Source: CME CVOL
Implied volatility spiked on the Hormuz shock, then collapsed as price extended. The market is not pricing in downside risk. IV is now near YTD lows while price sits at YTD highs. The minor recovery in recent days is worth watching.
Managed Money has started to cut back net long after a historic buildup:
Managed money entered 2026 deeply net short at -70K contracts, then flipped aggressively as the Hormuz shock and EPA Set 2 hit simultaneously. Positioning peaked at 170K net longs in the week ending May 5 before profit-taking set in. At 141K, longs are trimming but not exiting.
Historical Trade Setup
Russia-Ukraine Supply Shock — February 2022
Russia’s invasion of Ukraine on February 24, 2022 triggered an acute global vegetable oil supply shock. Sunflower oil exports from the Black Sea collapsed, driving demand rotation aggressively into soybean oil. A tactical long on ZLH22 (Soybean Oil Futures, March 2022) captured the ensuing rally.
CME Micro Soybean Oil Futures (MZL) were launched on February 24, 2025 and were not available during the 2022 period. The trade below uses micro contract sizing for illustration.
Long CME Micro Soybean Oil Futures, MZL (Illustrative Equivalent)
- Entry: USc 65.94/lb — February 24, 2022
- Exit: USc 82.63/lb — April 19, 2022
- Gross Profit: (82.63 − 65.94) × 6,000 / 100 = USD 1,001
This trade would have yielded a net gain of 25.3%.
EPA RFS Set 1 Mandate Announcement — June 2023
The EPA’s finalised RFS “Set 1” rule on June 21, 2023, raised the biomass-based diesel mandate to 2.82 billion gallons, lifting soybean oil prices as feedstock demand rose sharply. Despite an initial sell-the-news reaction on the day, the market grasped the scale of the demand shift and bid aggressively over the following weeks.
CME Micro Soybean Oil Futures (MZL) were launched on February 24, 2025 and were not available during the June 2023 period. The trade below uses micro contract sizing for illustration.
Long CME Micro Soybean Oil Futures, MZL (Illustrative Equivalent)
- Entry: USc 57.13/lb — June 21, 2023
- Exit: USc 68.21/lb — July 24, 2023
- Gross Profit: (68.21 − 57.13) × 6,000 / 100 = USD 665
This trade would have yielded a net gain of 19.4%.
In 2026, both types of catalysts are active simultaneously. The Hormuz closure brought the energy supply shock; the EPA Set 2 rule brought the demand mandate. Historically, either driver on its own has been enough to move soybean oil prices sharply. The current setup compounds them.
The ZL/ZM ratio measures soybean oil's price relative to soybean meal. Both come from the same crush process, but only soybean oil carries the biodiesel demand channel, which is what has driven the premium to current levels.
At 0.24, the ratio has moved above every level recorded in the past five years, including the Russia-Ukraine high of 0.20. In every prior instance, a spike of this magnitude was followed by compression. The EPA Set 2 mandate complicates the picture somewhat: it has raised the structural demand floor for soybean oil in a way prior cycles did not, so any reversion may be shallower than history alone would suggest. That said, at current levels, ZM is the leg most likely to recover relative ground.
This content is sponsored.
MARKET DATA
CME Real-time Market Data helps identify trading setups and more effectively express market views. If you have futures in your trading portfolio, you can check out on CME Group data plans available that suit your trading needs at tradingview.com/cme.
DISCLAIMER
This case study is for educational purposes only and does not constitute investment recommendations or advice. Nor are they used to promote any specific products, or services.
Trading or investment ideas cited here are for illustration only, as an integral part of a case study to demonstrate the fundamental concepts in risk management or trading under the market scenarios being discussed.

Full Disclaimer - linktr.ee/mintfinance
免責事項
これらの情報および投稿は、TradingViewが提供または承認する金融、投資、取引、またはその他の種類の助言もしくは推奨であることを意図したものではなく、またこれらに該当するものでもありません。詳細は利用規約をご覧ください。
Full Disclaimer - linktr.ee/mintfinance
免責事項
これらの情報および投稿は、TradingViewが提供または承認する金融、投資、取引、またはその他の種類の助言もしくは推奨であることを意図したものではなく、またこれらに該当するものでもありません。詳細は利用規約をご覧ください。