ロング
NANOBTC curve like movement
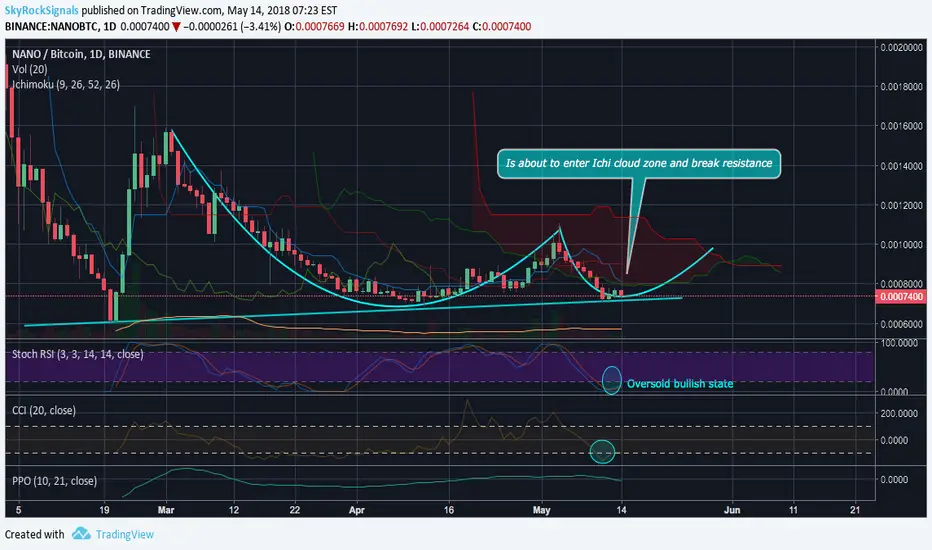
On a mid and long term timeframe charts the coin look very bullish. Technical indicators are in buy state, the price moves in curve like pattern bouncing from the trend line. Currently The asset is in oversold state and has bounced from its trend line. The price is about to enter Ichimoku cloud zone hence it should break local resistance. Stoch RSI and CCI confirms the possibility of such scenario. Fundamental analysis is also great: version 13.0 of the Nano Node has been released recently, update becomes more popular each day. The team visited the biggest crypto conference two days ago and plans to integrate in Ledger

Turn TradingView indicator & strategy alerts into automated trades on major crypto exchanges using no-code bots
Start free at skyrexio.com
Start free at skyrexio.com
免責事項
これらの情報および投稿は、TradingViewが提供または承認する金融、投資、取引、またはその他の種類の助言もしくは推奨であることを意図したものではなく、またこれらに該当するものでもありません。詳細は利用規約をご覧ください。
Turn TradingView indicator & strategy alerts into automated trades on major crypto exchanges using no-code bots
Start free at skyrexio.com
Start free at skyrexio.com
免責事項
これらの情報および投稿は、TradingViewが提供または承認する金融、投資、取引、またはその他の種類の助言もしくは推奨であることを意図したものではなく、またこれらに該当するものでもありません。詳細は利用規約をご覧ください。