
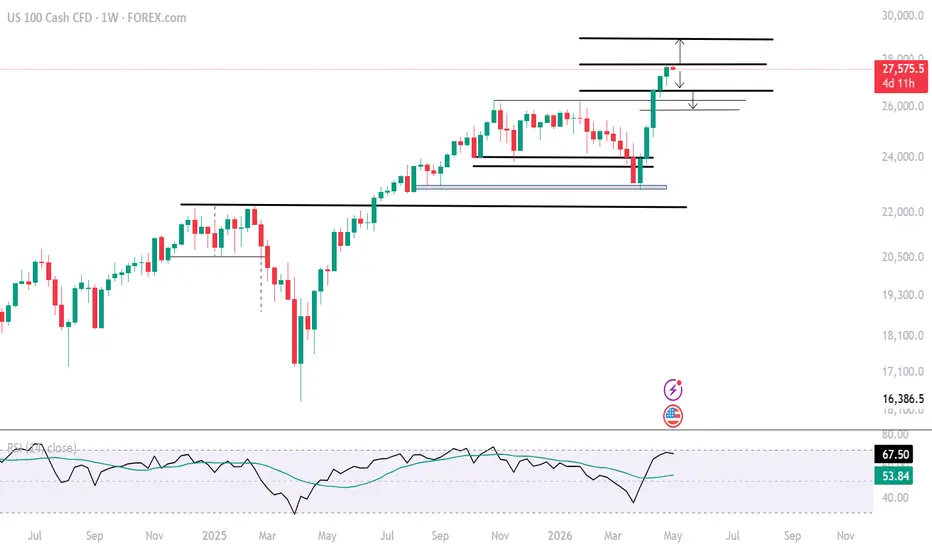
From a weekly perspective, Nasdaq momentum is showing signs of slowing near overbought levels, similar to prior peaks seen in 2024 and 2025. This raises the risk of a pullback or momentum unwind as markets realize the Q2 pressure from Hormuz-related risks over Q1 earnings.
Key levels to watch, derived using Fibonacci extensions between the April 2025 lows, October 2025 highs, and April 2026 lows, are:
27,800 (0.5)
28,900 (0.618)
30,660 (0.786)
On the downside, a break below 26,900 would reinforce a pullback toward 26,300, 26,100, and 25800, levels representing potential rebound opportunities
Written by Razan Hilal, CMT

免責事項
これらの情報および投稿は、TradingViewが提供または承認する金融、投資、取引、またはその他の種類の助言もしくは推奨であることを意図したものではなく、またこれらに該当するものでもありません。詳細は利用規約をご覧ください。
免責事項
これらの情報および投稿は、TradingViewが提供または承認する金融、投資、取引、またはその他の種類の助言もしくは推奨であることを意図したものではなく、またこれらに該当するものでもありません。詳細は利用規約をご覧ください。