
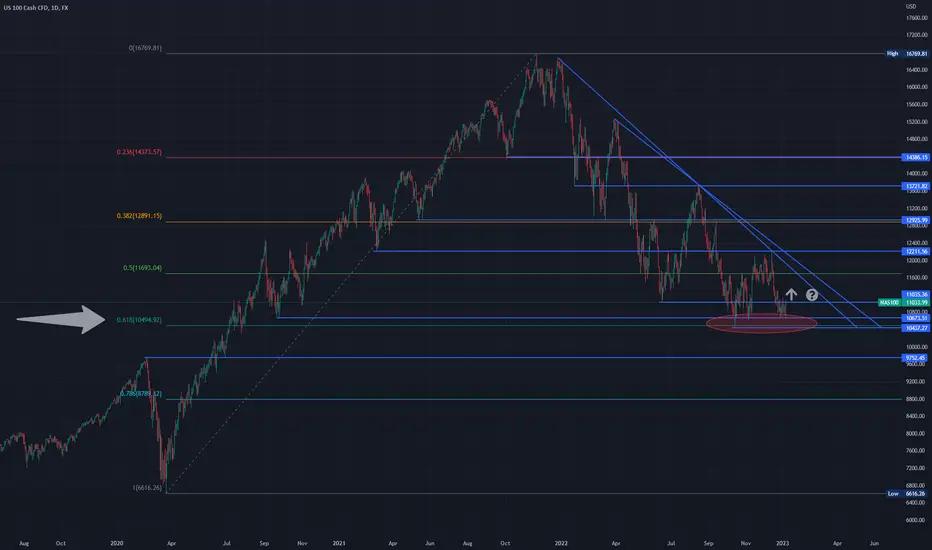
The NASDAQ 100 (cash chart) could bounce up from the 61.8 Fibonacci retracement (daily chart).
In this case, a rise of 5-10+ % could be possible.
In the chart, Fibonacci retracement levels have been plotted from the Covid low in March 2020 to the all-time high in November 2021.
This is just an idea. Do not trade it! Do your own research and make your own decisions. You are solely responsible for your trades.
In this case, a rise of 5-10+ % could be possible.
In the chart, Fibonacci retracement levels have been plotted from the Covid low in March 2020 to the all-time high in November 2021.
This is just an idea. Do not trade it! Do your own research and make your own decisions. You are solely responsible for your trades.

免責事項
これらの情報および投稿は、TradingViewが提供または承認する金融、投資、取引、またはその他の種類の助言もしくは推奨であることを意図したものではなく、またこれらに該当するものでもありません。詳細は利用規約をご覧ください。
免責事項
これらの情報および投稿は、TradingViewが提供または承認する金融、投資、取引、またはその他の種類の助言もしくは推奨であることを意図したものではなく、またこれらに該当するものでもありません。詳細は利用規約をご覧ください。