
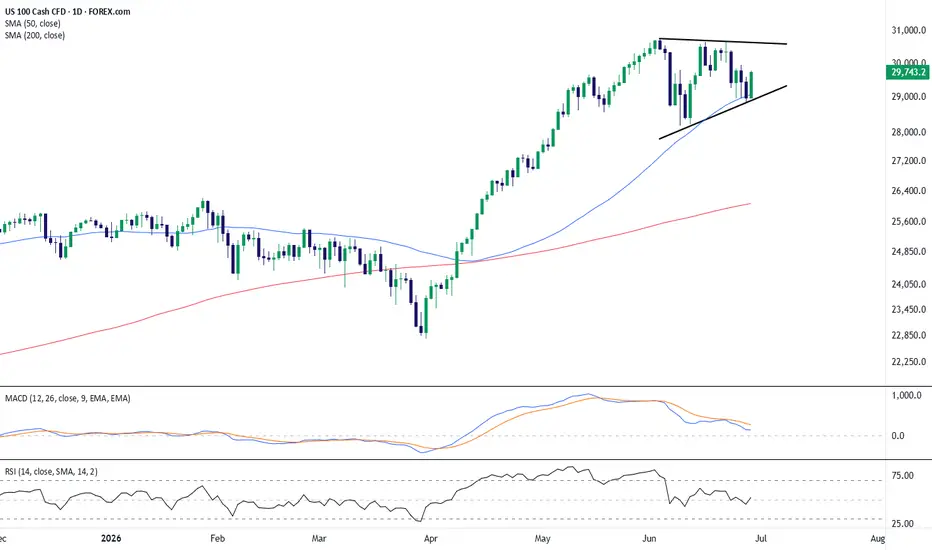
The US100 is holding within a tightening consolidation structure after a strong upside move from the April lows. Price is currently trading near the lower rising trendline of the recent range, while the upper boundary continues to cap momentum around the prior highs. This creates a compressed structure that may become increasingly important as price approaches the apex.
The broader trend remains constructive, with price still positioned above both the 50-day and 200-day SMAs. The 50-day SMA is rising and remains above the 200-day SMA, supporting the view that the larger trend has not yet broken down. However, the recent candles show hesitation near the upper end of the range, suggesting short-term momentum has cooled compared with the strong advance seen through April and May.
Momentum indicators are also showing a more neutral tone. The MACD remains above the zero line but has been trending lower, reflecting fading bullish momentum. RSI is sitting near the midline around 52, which suggests neither overbought nor oversold conditions at the moment. This supports a neutral-to-cautiously bullish bias while price remains above the rising trendline and key moving averages.
Overall, the chart appears to be in a consolidation phase within a broader uptrend. A sustained hold above trend support may keep the structure constructive, while a break below the lower boundary would suggest a deeper corrective phase could be developing.
-MW
The broader trend remains constructive, with price still positioned above both the 50-day and 200-day SMAs. The 50-day SMA is rising and remains above the 200-day SMA, supporting the view that the larger trend has not yet broken down. However, the recent candles show hesitation near the upper end of the range, suggesting short-term momentum has cooled compared with the strong advance seen through April and May.
Momentum indicators are also showing a more neutral tone. The MACD remains above the zero line but has been trending lower, reflecting fading bullish momentum. RSI is sitting near the midline around 52, which suggests neither overbought nor oversold conditions at the moment. This supports a neutral-to-cautiously bullish bias while price remains above the rising trendline and key moving averages.
Overall, the chart appears to be in a consolidation phase within a broader uptrend. A sustained hold above trend support may keep the structure constructive, while a break below the lower boundary would suggest a deeper corrective phase could be developing.
-MW

免責事項
これらの情報および投稿は、TradingViewが提供または承認する金融、投資、取引、またはその他の種類の助言もしくは推奨であることを意図したものではなく、またこれらに該当するものでもありません。詳細は利用規約をご覧ください。
免責事項
これらの情報および投稿は、TradingViewが提供または承認する金融、投資、取引、またはその他の種類の助言もしくは推奨であることを意図したものではなく、またこれらに該当するものでもありません。詳細は利用規約をご覧ください。