
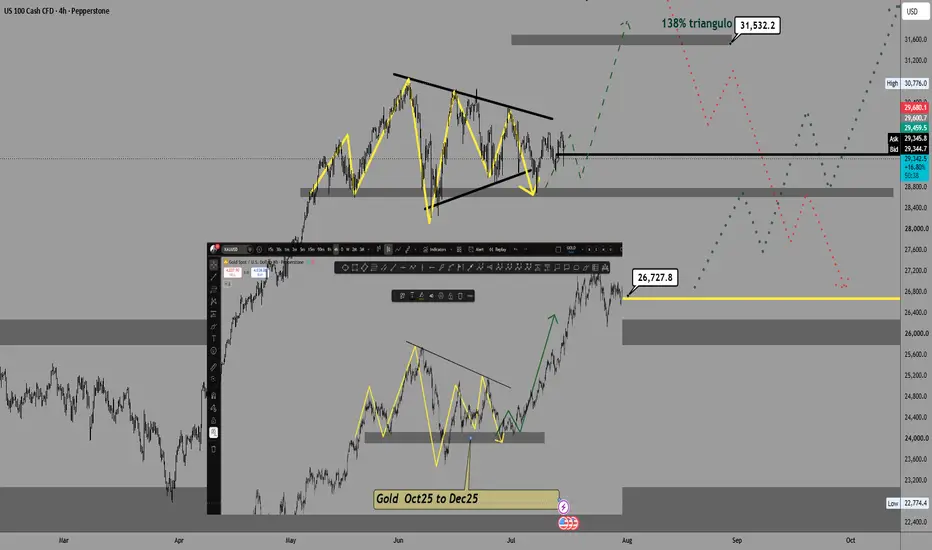
I’ve been observing a very interesting structure in the Nasdaq (NAS100) since May 26th. Upon comparing the charts, I’ve noticed a remarkable technical correlation with the formation that Gold (XAU/USD) displayed between October and December of last year.
As you can see in the chart, the consolidation/triangle pattern is almost a mirror image. If the market respects this fractal structure, we could be looking at a bullish continuation signal similar to the one Gold executed back then.
What do you think? Are we seeing a repetition of algorithmic behavior, or just a technical coincidence? Let me know your thoughts in the comments.
As you can see in the chart, the consolidation/triangle pattern is almost a mirror image. If the market respects this fractal structure, we could be looking at a bullish continuation signal similar to the one Gold executed back then.
What do you think? Are we seeing a repetition of algorithmic behavior, or just a technical coincidence? Let me know your thoughts in the comments.

免責事項
これらの情報および投稿は、TradingViewが提供または承認する金融、投資、取引、またはその他の種類の助言もしくは推奨であることを意図したものではなく、またこれらに該当するものでもありません。詳細は利用規約をご覧ください。
免責事項
これらの情報および投稿は、TradingViewが提供または承認する金融、投資、取引、またはその他の種類の助言もしくは推奨であることを意図したものではなく、またこれらに該当するものでもありません。詳細は利用規約をご覧ください。