
Monthly has large wicks rejecting 14000 price area. 2 months back-to-back. Monthly Bullish Engulfing as well.
Weekly candle stick analysis could be a double bottom forming or a higher low. Due to Daily analysis expecting this to be a weekly higher low.
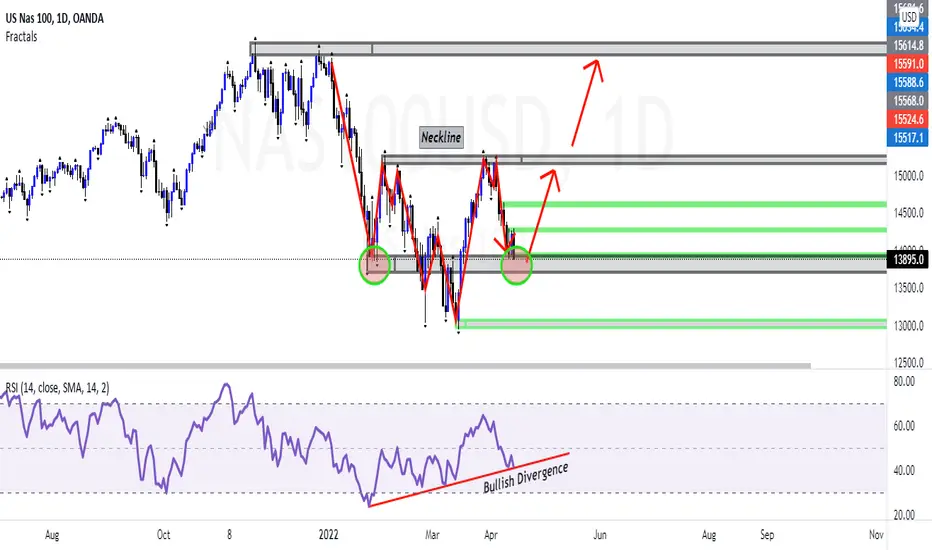
Daily has created an inverse head & shoulder pattern with bullish divergence.
If price rejects this zone and breaks structure for turnaround of buys. Expecting price to continue pattern to upside near 15600 long term.

免責事項
これらの情報および投稿は、TradingViewが提供または承認する金融、投資、取引、またはその他の種類の助言もしくは推奨であることを意図したものではなく、またこれらに該当するものでもありません。詳細は利用規約をご覧ください。
免責事項
これらの情報および投稿は、TradingViewが提供または承認する金融、投資、取引、またはその他の種類の助言もしくは推奨であることを意図したものではなく、またこれらに該当するものでもありません。詳細は利用規約をご覧ください。