
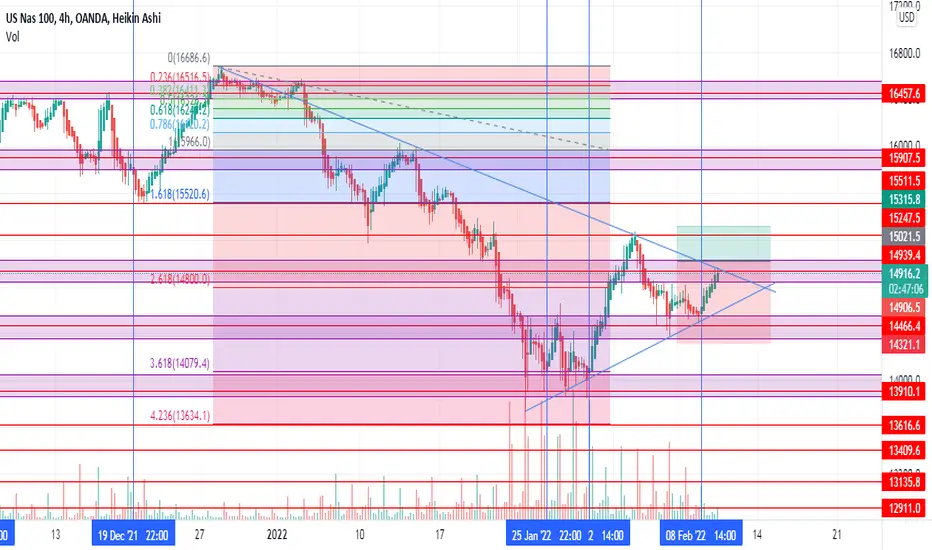
On the Daily timeframe we see a clear downtrend. It touches the trendline more than 5 times, indicating the correct direction of the market. If the market breaks the trendline it should head to the 15072.9 area. On the 4H we see some price action in the key area or golden area, the 618 on the Fibonacci retracement. If it does not break the trendline, it should come down to 14649.3 whhere it should bounce off the trendline and go up.

免責事項
これらの情報および投稿は、TradingViewが提供または承認する金融、投資、取引、またはその他の種類の助言もしくは推奨であることを意図したものではなく、またこれらに該当するものでもありません。詳細は利用規約をご覧ください。
免責事項
これらの情報および投稿は、TradingViewが提供または承認する金融、投資、取引、またはその他の種類の助言もしくは推奨であることを意図したものではなく、またこれらに該当するものでもありません。詳細は利用規約をご覧ください。