
HI Guys,
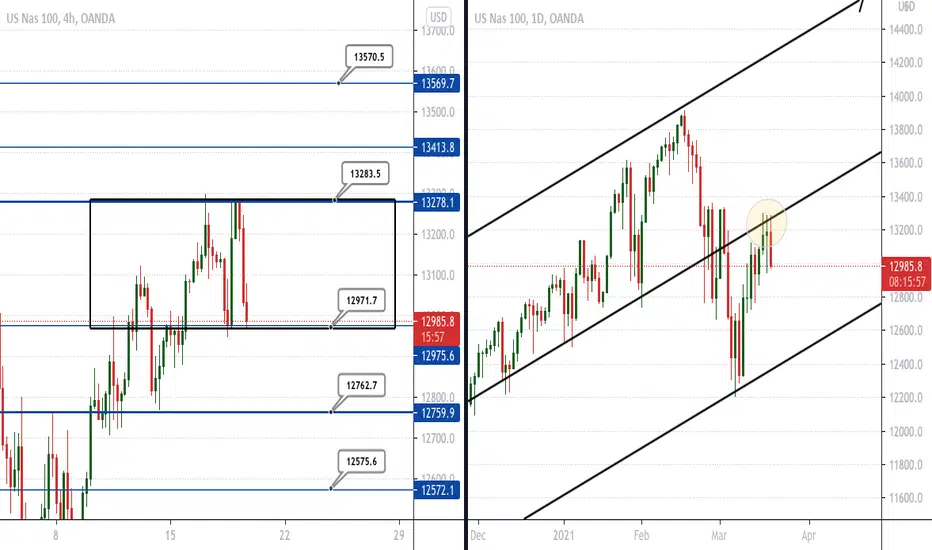
So nasdaq is kinda ranging at the moment with the struggle of break through 13283. This level has been tested many times and failed. I have put the daily chart today do show you what is happening in higher timeframe. You can see the level 13283 is also in line with a key trend line which its also trying to break and has failed many time. This trend is still very bullish overall.
In the short time let see what may happen, if we get a break of 12971 then price will likely come down to 12762- 12575. However if the price does bounce of 12971 then we can see it come back to 13283 which may likely break this time. taking us to one of the key level above it.
🔴 50% off this week on the NASDAQ Course. Limited time. Get in touch now
So nasdaq is kinda ranging at the moment with the struggle of break through 13283. This level has been tested many times and failed. I have put the daily chart today do show you what is happening in higher timeframe. You can see the level 13283 is also in line with a key trend line which its also trying to break and has failed many time. This trend is still very bullish overall.
In the short time let see what may happen, if we get a break of 12971 then price will likely come down to 12762- 12575. However if the price does bounce of 12971 then we can see it come back to 13283 which may likely break this time. taking us to one of the key level above it.
🔴 50% off this week on the NASDAQ Course. Limited time. Get in touch now

免責事項
これらの情報および投稿は、TradingViewが提供または承認する金融、投資、取引、またはその他の種類の助言もしくは推奨であることを意図したものではなく、またこれらに該当するものでもありません。詳細は利用規約をご覧ください。
免責事項
これらの情報および投稿は、TradingViewが提供または承認する金融、投資、取引、またはその他の種類の助言もしくは推奨であることを意図したものではなく、またこれらに該当するものでもありません。詳細は利用規約をご覧ください。