ロング
Nebulas (NASBTC) will go wild. 100x long term
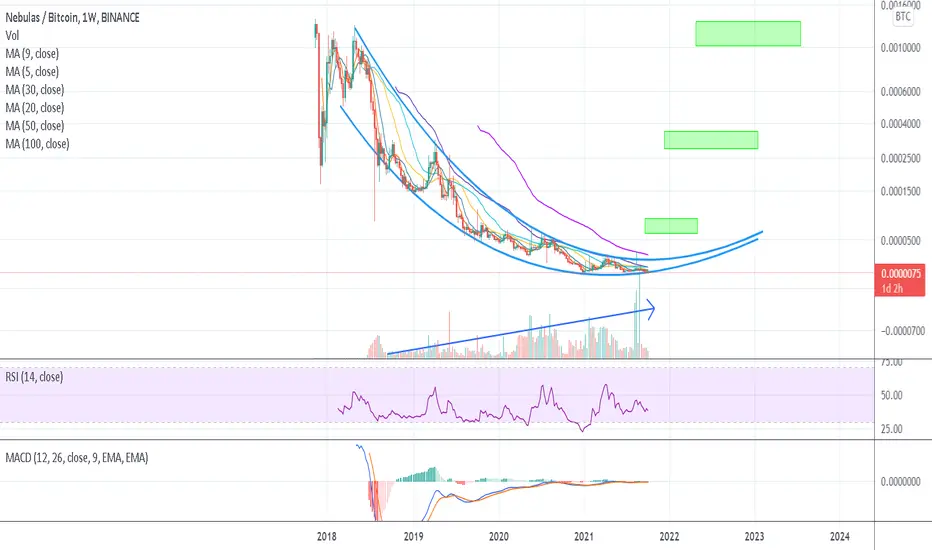
Weekly chart - logarithmic view
- We can see a neverending price drop for the last 3 years, paired with volume growth. Big bullish divergence.
- price is tightening its pressure to major MAs
- price trend curves are tightening to the limit. once broken, price is going to boom
sell at each major target and rebuy lower for the long run.
cheers,
Baked finance
this post is for educational purposes only and not investment advice. do your own research
- We can see a neverending price drop for the last 3 years, paired with volume growth. Big bullish divergence.
- price is tightening its pressure to major MAs
- price trend curves are tightening to the limit. once broken, price is going to boom
sell at each major target and rebuy lower for the long run.
cheers,
Baked finance
this post is for educational purposes only and not investment advice. do your own research

関連の投稿
免責事項
これらの情報および投稿は、TradingViewが提供または承認する金融、投資、取引、またはその他の種類の助言もしくは推奨であることを意図したものではなく、またこれらに該当するものでもありません。詳細は利用規約をご覧ください。
関連の投稿
免責事項
これらの情報および投稿は、TradingViewが提供または承認する金融、投資、取引、またはその他の種類の助言もしくは推奨であることを意図したものではなく、またこれらに該当するものでもありません。詳細は利用規約をご覧ください。