ロング
NATURAL GAS-Did we bottom?
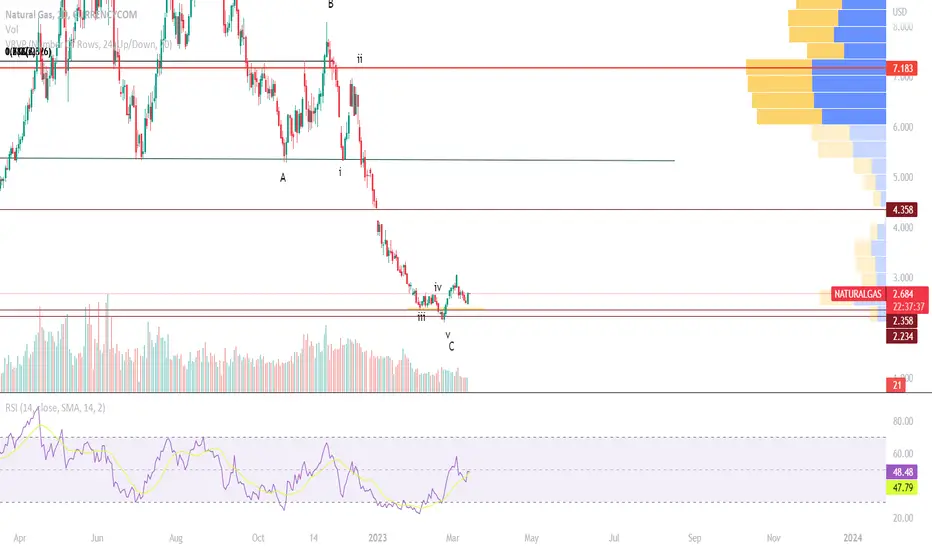
During previous posts, linked in description, we tracked the bearish patterns unfolding in a macro ABC to the downside in Natural Gas.
Now, targets of wave C are reached and the structure seems complete. Bulls where shaken a bit out, and price reacted impulsively from 2.115, and then retraced to the Golden fibo zone, where today's daily candle was printed. Natgas may be now reversing to the upside.

Now, targets of wave C are reached and the structure seems complete. Bulls where shaken a bit out, and price reacted impulsively from 2.115, and then retraced to the Golden fibo zone, where today's daily candle was printed. Natgas may be now reversing to the upside.
ノート
waiting for the green box
ノート
no signs of reversalトレード稼働中
ww activated, long order @2.346
トレード稼働中
order triggered, stop loss on entry
ノート
Long got closed on entry, and we did not re enter.Current situation
wolfe wave is failing, but still no lower low.
No positions for now
トレード稼働中
ww saved and popgun bar pattern: long from 2.344 stop loss 2.29 risk 0.5%
注文をキャンセル
closed before closing on invers hammer. Loss 0.4%トレード稼働中
last chance before invalidation
ノート
still no positions.. no reaction until now.. this can easily die lower..トレード稼働中
here some reaction. Longed @2.13 stop loss 2.1 risk 0.4%
手動でトレードを終了しました
closed on entryトレード稼働中
restriked on fake out 2.11@手動でトレードを終了しました
closed with small gain
関連の投稿
免責事項
これらの情報および投稿は、TradingViewが提供または承認する金融、投資、取引、またはその他の種類の助言もしくは推奨であることを意図したものではなく、またこれらに該当するものでもありません。詳細は利用規約をご覧ください。
関連の投稿
免責事項
これらの情報および投稿は、TradingViewが提供または承認する金融、投資、取引、またはその他の種類の助言もしくは推奨であることを意図したものではなく、またこれらに該当するものでもありません。詳細は利用規約をご覧ください。