
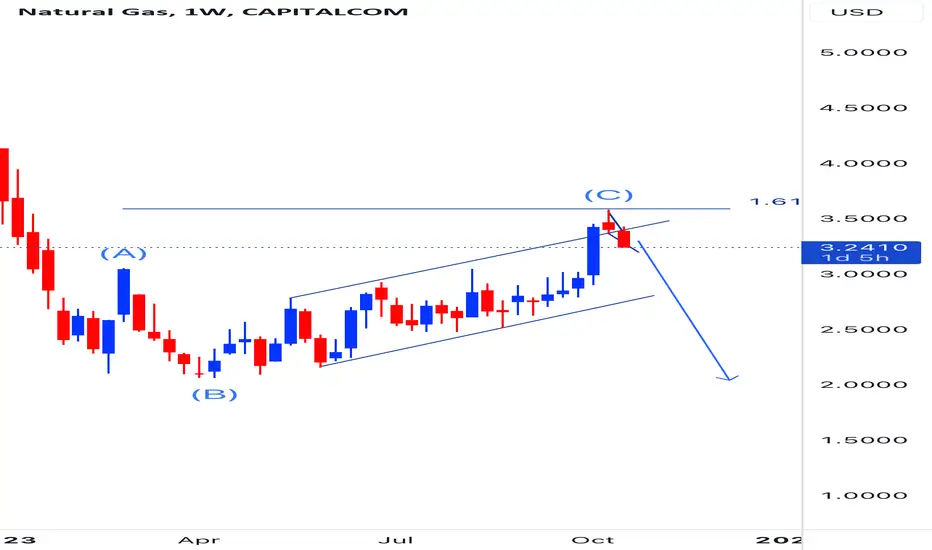
Natural gas - Elliott wave count
Weekly chart seems like bearish which is completely opposite to our view which we posted earlier.. this bearish view also possible so better be careful or atleast wait for some good reversal signal to take buy.
This is an update to the previous view posted.
Weekly chart seems like bearish which is completely opposite to our view which we posted earlier.. this bearish view also possible so better be careful or atleast wait for some good reversal signal to take buy.
This is an update to the previous view posted.

関連の投稿
免責事項
これらの情報および投稿は、TradingViewが提供または承認する金融、投資、取引、またはその他の種類の助言もしくは推奨であることを意図したものではなく、またこれらに該当するものでもありません。詳細は利用規約をご覧ください。
免責事項
これらの情報および投稿は、TradingViewが提供または承認する金融、投資、取引、またはその他の種類の助言もしくは推奨であることを意図したものではなく、またこれらに該当するものでもありません。詳細は利用規約をご覧ください。