
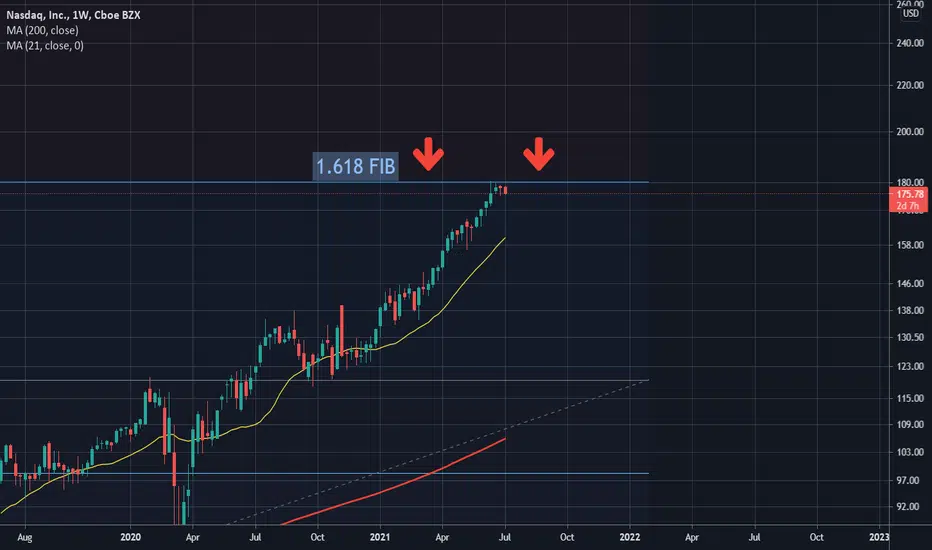
The weekly chart of the Nasdaq index is showing weakness with multiple weekly candle rejections at exactly the 1.618 fibonacci extension level.
This is key to note as the 1.618 as many know is often the first place traders short, sell and or take profits after price breaks all time high. So paying attention to the $180 level will be important. If bulls can ever get a weekly close above this level, the run up can continue.
Until then, proceed with caution this week and probably the next if your portfolio is very tech stock heavy.
This is key to note as the 1.618 as many know is often the first place traders short, sell and or take profits after price breaks all time high. So paying attention to the $180 level will be important. If bulls can ever get a weekly close above this level, the run up can continue.
Until then, proceed with caution this week and probably the next if your portfolio is very tech stock heavy.

関連の投稿
免責事項
これらの情報および投稿は、TradingViewが提供または承認する金融、投資、取引、またはその他の種類の助言もしくは推奨であることを意図したものではなく、またこれらに該当するものでもありません。詳細は利用規約をご覧ください。
免責事項
これらの情報および投稿は、TradingViewが提供または承認する金融、投資、取引、またはその他の種類の助言もしくは推奨であることを意図したものではなく、またこれらに該当するものでもありません。詳細は利用規約をご覧ください。