
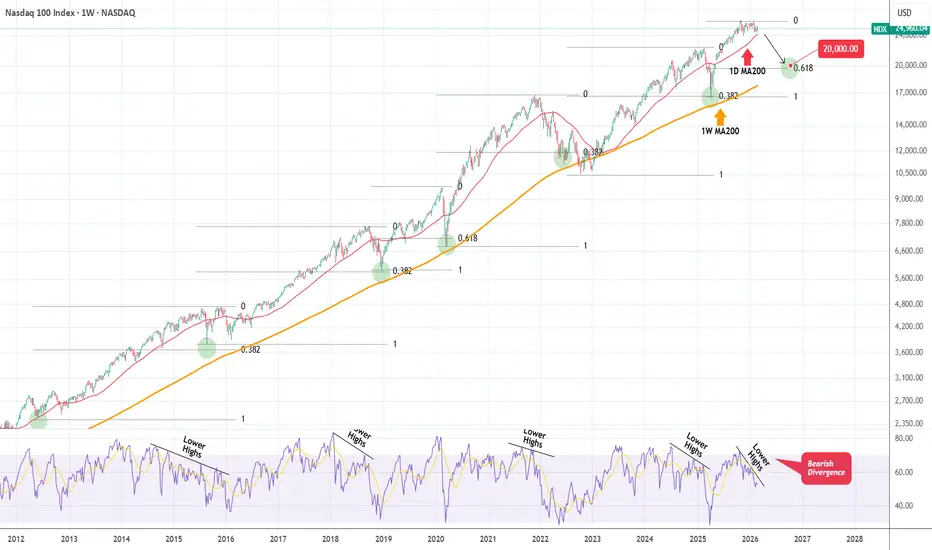
Nasdaq (NDX) has been trading practically sideways since the late October market High and following the Middle East escalations, it is about to test its 1D MA200 (red trend-line). This trend-line has been intact for 9 months straight (since early May 2025), so it is a key long-term Support.
If broken, it can technically be the trigger for a strong year-long correction towards the 1W MA200 (orange trend-line). This has been the market's natural long-term Support, as in almost 16 years (since June 2010) it only broke marginally in late 2022 during the Inflation Crisis. Besides that, it successfully held and supported (green circles) the corrections of early 2025, COVID crash in early 2020, late 2018 and mid 2015.
Most corrections found support on their 0.382 Fibonacci retracement levels from their respective Lows, but this one looks very similar to early 2020, which hit its 0.618 Fib. So if the 1D MA200 does break and a strong correction takes place, a 0.618 Fib test would take us just above the 1W MA200, ideally fitting this multi-year model.
In this case our Target would be 20000. Notice also the 1W RSI Lower Highs Bearish Divergence currently, similar to all previous market Tops.
---
** Please LIKE 👍, FOLLOW ✅, SHARE 🙌 and COMMENT ✍ if you enjoy this idea! Also share your ideas and charts in the comments section below! This is best way to keep it relevant, support us, keep the content here free and allow the idea to reach as many people as possible. **
---
💸💸💸💸💸💸
👇 👇 👇 👇 👇 👇
If broken, it can technically be the trigger for a strong year-long correction towards the 1W MA200 (orange trend-line). This has been the market's natural long-term Support, as in almost 16 years (since June 2010) it only broke marginally in late 2022 during the Inflation Crisis. Besides that, it successfully held and supported (green circles) the corrections of early 2025, COVID crash in early 2020, late 2018 and mid 2015.
Most corrections found support on their 0.382 Fibonacci retracement levels from their respective Lows, but this one looks very similar to early 2020, which hit its 0.618 Fib. So if the 1D MA200 does break and a strong correction takes place, a 0.618 Fib test would take us just above the 1W MA200, ideally fitting this multi-year model.
In this case our Target would be 20000. Notice also the 1W RSI Lower Highs Bearish Divergence currently, similar to all previous market Tops.
---
** Please LIKE 👍, FOLLOW ✅, SHARE 🙌 and COMMENT ✍ if you enjoy this idea! Also share your ideas and charts in the comments section below! This is best way to keep it relevant, support us, keep the content here free and allow the idea to reach as many people as possible. **
---
💸💸💸💸💸💸
👇 👇 👇 👇 👇 👇

I trade Crypto, Forex, Indices & Commodities on PrimeXBT — all from one account with TradingView charts 👉 tradingshot.short.gy/PrimeXBT
I also use TradeNation for fixed spreads & zero commission 👉 tradingshot.short.gy/Tradenation
I also use TradeNation for fixed spreads & zero commission 👉 tradingshot.short.gy/Tradenation
免責事項
これらの情報および投稿は、TradingViewが提供または承認する金融、投資、取引、またはその他の種類の助言もしくは推奨であることを意図したものではなく、またこれらに該当するものでもありません。詳細は利用規約をご覧ください。
I trade Crypto, Forex, Indices & Commodities on PrimeXBT — all from one account with TradingView charts 👉 tradingshot.short.gy/PrimeXBT
I also use TradeNation for fixed spreads & zero commission 👉 tradingshot.short.gy/Tradenation
I also use TradeNation for fixed spreads & zero commission 👉 tradingshot.short.gy/Tradenation
免責事項
これらの情報および投稿は、TradingViewが提供または承認する金融、投資、取引、またはその他の種類の助言もしくは推奨であることを意図したものではなく、またこれらに該当するものでもありません。詳細は利用規約をご覧ください。