
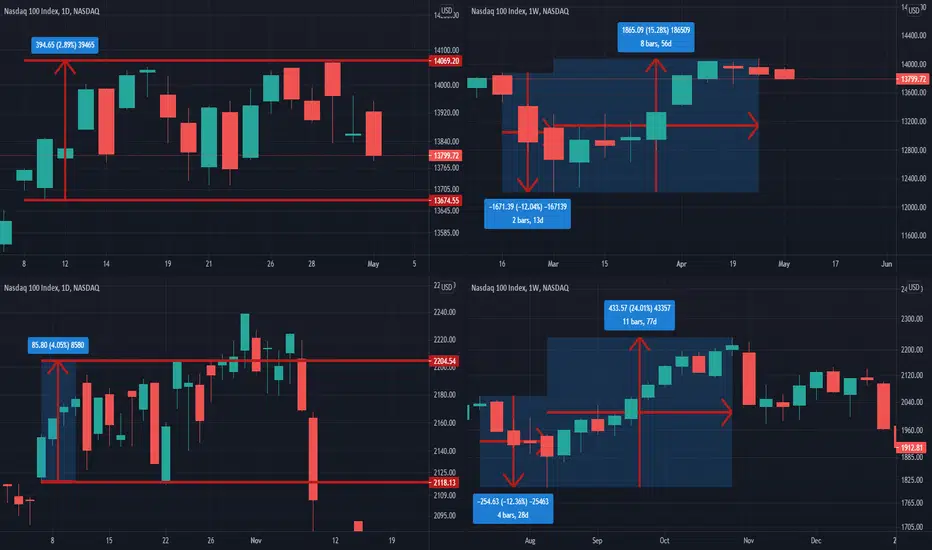
Above charts: daily chart since April 9th 2021and weekly chart since mid-February 2021.
Below cheats: daily chart since October 5th, 2007 and weekly chart since July 2007. (just before market crash)
I think these chart patterns have lots of similarities, you may argue that, but always it is better to be cautious.
If a similar scenario happening in the coming days, do you have a plan for that?
Below cheats: daily chart since October 5th, 2007 and weekly chart since July 2007. (just before market crash)
I think these chart patterns have lots of similarities, you may argue that, but always it is better to be cautious.
If a similar scenario happening in the coming days, do you have a plan for that?

Use the following link to access trading ideas: patreon.com/SniperTraderStocks?utm_medium=unknown&utm_source=join_link&utm_campaign=creatorshare_creator&utm_content=copyLink
免責事項
これらの情報および投稿は、TradingViewが提供または承認する金融、投資、取引、またはその他の種類の助言もしくは推奨であることを意図したものではなく、またこれらに該当するものでもありません。詳細は利用規約をご覧ください。
Use the following link to access trading ideas: patreon.com/SniperTraderStocks?utm_medium=unknown&utm_source=join_link&utm_campaign=creatorshare_creator&utm_content=copyLink
免責事項
これらの情報および投稿は、TradingViewが提供または承認する金融、投資、取引、またはその他の種類の助言もしくは推奨であることを意図したものではなく、またこれらに該当するものでもありません。詳細は利用規約をご覧ください。