
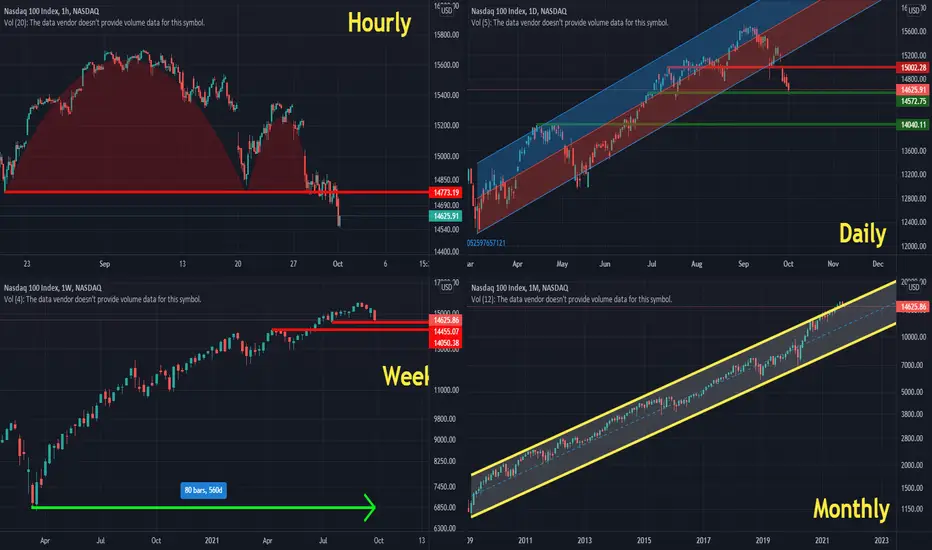
Hourly Chart: Reverse cup and handle pattern (Bearish)
Daily Chart: getting out of Bullish regression Channel and Higher-high higher-low pattern(Bearish)
Weekly Chart: Closing at lower levels for 4 weeks in a row for the first time in the past 80 weeks! (Bearish)
Monthly Chart: September was the Biggest monthly negative candle (-5.73%) in the past 18 months! (Bearish)
Conclusion: I believe this could continue for the next 2-3 weeks and we may find a support level near 14050 level.
Being patient in a market like this will pay off and provide good opportunities, however, you should not forget the best friend you have in the market is your "Stop Loss".
Daily Chart: getting out of Bullish regression Channel and Higher-high higher-low pattern(Bearish)
Weekly Chart: Closing at lower levels for 4 weeks in a row for the first time in the past 80 weeks! (Bearish)
Monthly Chart: September was the Biggest monthly negative candle (-5.73%) in the past 18 months! (Bearish)
Conclusion: I believe this could continue for the next 2-3 weeks and we may find a support level near 14050 level.
Being patient in a market like this will pay off and provide good opportunities, however, you should not forget the best friend you have in the market is your "Stop Loss".

Use the following link to access trading ideas: patreon.com/SniperTraderStocks?utm_medium=unknown&utm_source=join_link&utm_campaign=creatorshare_creator&utm_content=copyLink
免責事項
これらの情報および投稿は、TradingViewが提供または承認する金融、投資、取引、またはその他の種類の助言もしくは推奨であることを意図したものではなく、またこれらに該当するものでもありません。詳細は利用規約をご覧ください。
Use the following link to access trading ideas: patreon.com/SniperTraderStocks?utm_medium=unknown&utm_source=join_link&utm_campaign=creatorshare_creator&utm_content=copyLink
免責事項
これらの情報および投稿は、TradingViewが提供または承認する金融、投資、取引、またはその他の種類の助言もしくは推奨であることを意図したものではなく、またこれらに該当するものでもありません。詳細は利用規約をご覧ください。