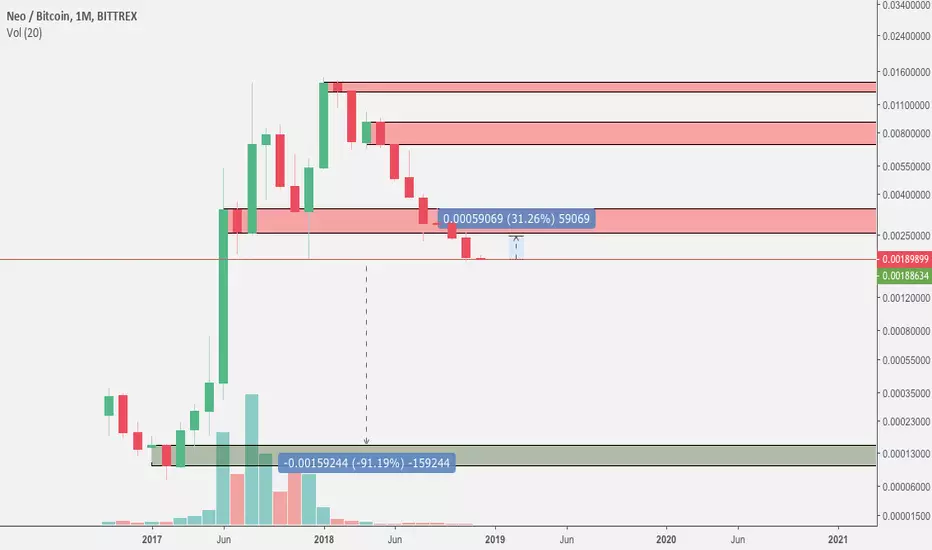
The monthly chart of neobtc looks pretty dangerous, if you're bullish on the NEO project.
Risk averse traders better stay out of NEO at the moment. If you look at weekly/daily levels, you'll see NEO is hanging on the cliff of at least 90% more downwards movements.
However, risk-loving traders might see this as an opportunity. A recovery of NEO might lead to a bounce of 30%. With a tight stop-loss, there are possibilities..
Risk averse traders better stay out of NEO at the moment. If you look at weekly/daily levels, you'll see NEO is hanging on the cliff of at least 90% more downwards movements.
However, risk-loving traders might see this as an opportunity. A recovery of NEO might lead to a bounce of 30%. With a tight stop-loss, there are possibilities..
注文をキャンセル
MISSED A SUPPORT LEVEL. NEW CHART POSTED.
免責事項
これらの情報および投稿は、TradingViewが提供または承認する金融、投資、取引、またはその他の種類の助言もしくは推奨であることを意図したものではなく、またこれらに該当するものでもありません。詳細は利用規約をご覧ください。
免責事項
これらの情報および投稿は、TradingViewが提供または承認する金融、投資、取引、またはその他の種類の助言もしくは推奨であることを意図したものではなく、またこれらに該当するものでもありません。詳細は利用規約をご覧ください。