アップデート済
NEO Trading Idea
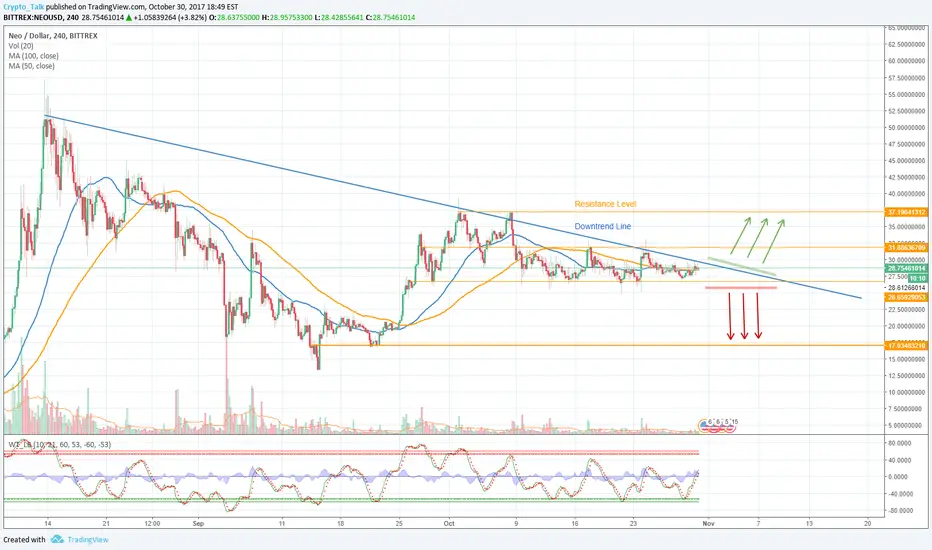
Let's look at the 4h chart of NEO and try to spot possible price movements. We can see that price reach an important zone formed by the downtrend line and 31.8 resistance level. If price breaks the downtrend line, that we have a possible long opportunity. If price breaks support line ~26.7, we'll have a sell signal.
P.S. If you think this information can be useful, please, like it and share. Thank you!
P.S. If you think this information can be useful, please, like it and share. Thank you!
トレード終了: 利益確定目標に到達

免責事項
これらの情報および投稿は、TradingViewが提供または承認する金融、投資、取引、またはその他の種類の助言もしくは推奨であることを意図したものではなく、またこれらに該当するものでもありません。詳細は利用規約をご覧ください。
免責事項
これらの情報および投稿は、TradingViewが提供または承認する金融、投資、取引、またはその他の種類の助言もしくは推奨であることを意図したものではなく、またこれらに該当するものでもありません。詳細は利用規約をご覧ください。