NEO - nice chart
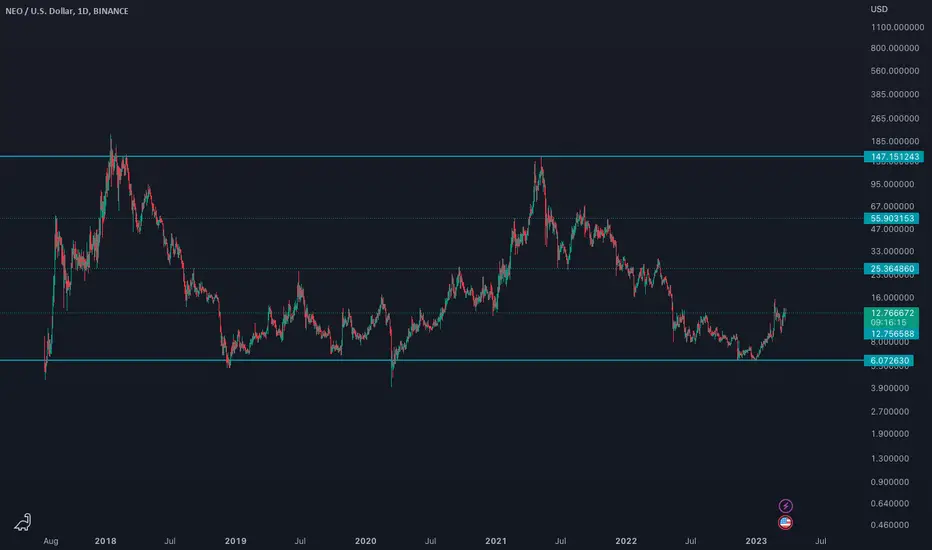
The NEO chart, very nice how it moved in 5 years between a very strong support and resistance and 3 other lines that were alternately when support, when resistance. Of course, on the 1D timeframe. What will NEO do next? We follow his evolution. Now everything seems simpler and it seems easier to identify a bottom or a top.

免責事項
これらの情報および投稿は、TradingViewが提供または承認する金融、投資、取引、またはその他の種類の助言もしくは推奨であることを意図したものではなく、またこれらに該当するものでもありません。詳細は利用規約をご覧ください。
免責事項
これらの情報および投稿は、TradingViewが提供または承認する金融、投資、取引、またはその他の種類の助言もしくは推奨であることを意図したものではなく、またこれらに該当するものでもありません。詳細は利用規約をご覧ください。