
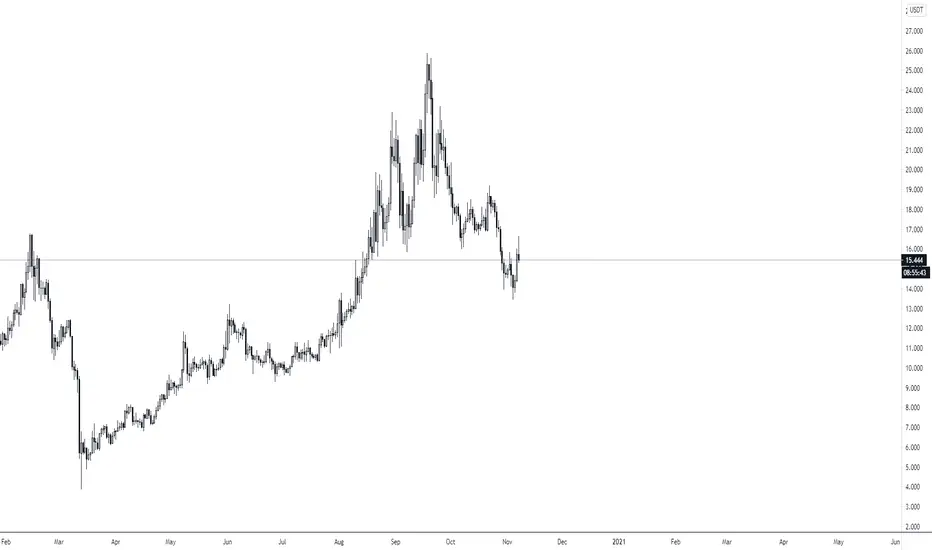
TOP DOWN ANALYSIS ON NEOUSDT
ノート
On the daily timeframe, market has been on a strong bullish run since March till date. Again, we can also see two respected support and resistance zones accompanied by a head and shoulder formation which price had broken the neckline and currently in for a retest.
ノート
On a 4 hour timeframe, we can spot the down trending channel. The small red zone that has been marked out is an obvious fake out. Price is currently at resistance of the channel which is also the confirmed resistance zone.
ノート
Evidences on daily and 4 hour timeframe proves that the odds that the market will be bearish on a long term is much higher. However, it is very important to make sure you manage your risks on whatever trading decisions you intent to make with live funds.
関連の投稿
免責事項
これらの情報および投稿は、TradingViewが提供または承認する金融、投資、取引、またはその他の種類の助言もしくは推奨であることを意図したものではなく、またこれらに該当するものでもありません。詳細は利用規約をご覧ください。
免責事項
これらの情報および投稿は、TradingViewが提供または承認する金融、投資、取引、またはその他の種類の助言もしくは推奨であることを意図したものではなく、またこれらに該当するものでもありません。詳細は利用規約をご覧ください。