
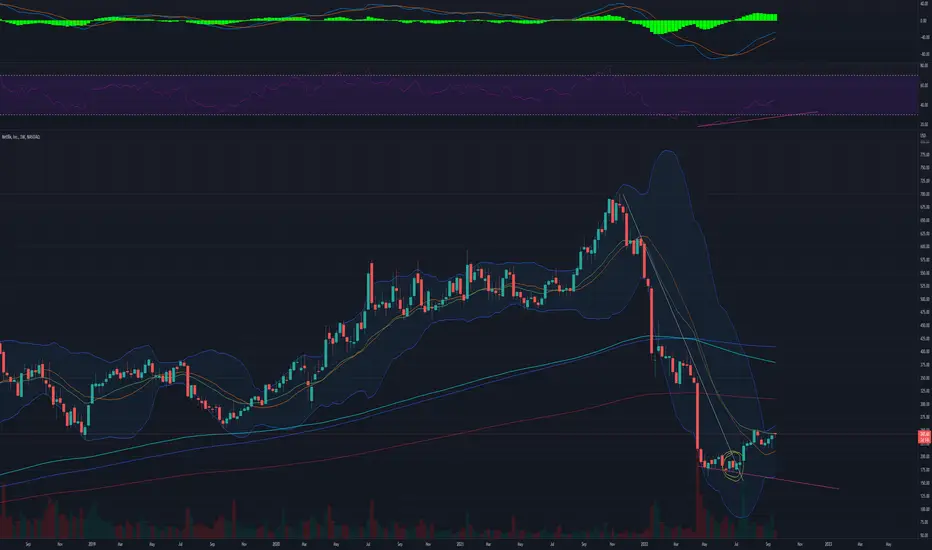
A simple trendline following the Netflix crash. I drew it in when there was a clear second local top/peak. This local top was confirmed by the April 20 crash. There is no need to try and "catch the falling knife" as eventually NFLX trended sideways until it broke the trend line . This is shown circled in yellow. Once it broke and pulled back to the trend (almost. ladder in.) line there was a good buying opportunity around $169. I decided to publish this simple chart because to me it is such a good example of some basics. I am looking for this sort of scenario to occur for BTC in the not so distant future.
Note: Additional TA; bullish divergence shown with pink trend lines .
Note: Additional TA; bullish divergence shown with pink trend lines .

免責事項
これらの情報および投稿は、TradingViewが提供または承認する金融、投資、取引、またはその他の種類の助言もしくは推奨であることを意図したものではなく、またこれらに該当するものでもありません。詳細は利用規約をご覧ください。
免責事項
これらの情報および投稿は、TradingViewが提供または承認する金融、投資、取引、またはその他の種類の助言もしくは推奨であることを意図したものではなく、またこれらに該当するものでもありません。詳細は利用規約をご覧ください。