 NFLX
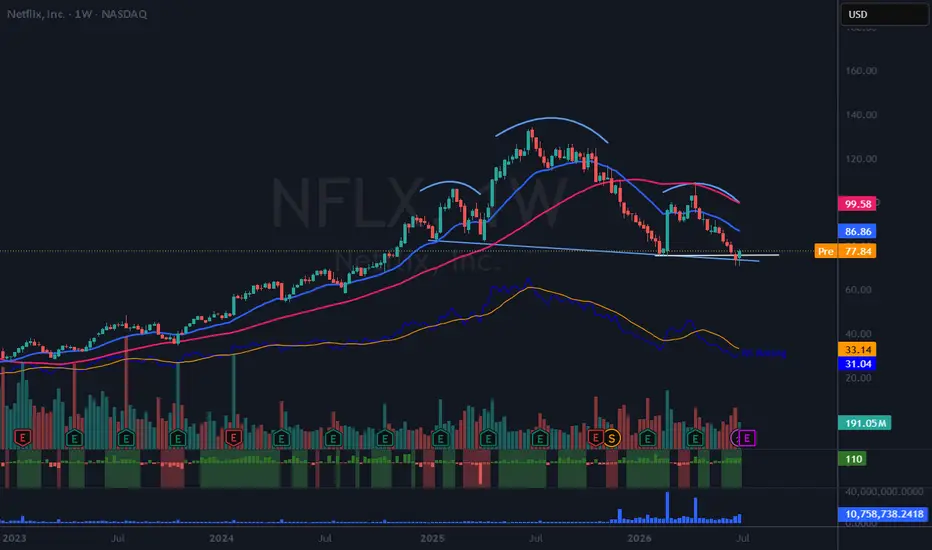
This could be a failed breakdown of a head and shoulders pattern AND an undercut and rally. (White line shows undercut and rally area.) All TBD.
I am back from a much needed 2 week vacation. This one caught my eye. Maybe worth putting on your watchlist.
If I take a position, I'll update this post.
トレード稼働中
This trade has been active since breaking above the neckline. Here are my updated thoughts:NFLX appears to have invalidated the head-and-shoulders pattern I previously noted on the weekly chart above.This 65-minute chart shows Netflix forming a flat base over the past two to three days. It is currently my largest position at 2.5 times my normal size, and I may increase it to 3 times normal if it breaks above the upper horizontal line. I believe it can reclaim its recent highs above $106, though I do not expect a straight move higher. I will use a trailing stop on a decisive close below the 21 EMA.

Ideas I publish are my own. They are not meant to be investment / trading advice. You are encouraged to do your own due diligence.
I am under no obligation to post any action or update to any idea.
Follow me on "X" where I post more content.
I am under no obligation to post any action or update to any idea.
Follow me on "X" where I post more content.
免責事項
これらの情報および投稿は、TradingViewが提供または承認する金融、投資、取引、またはその他の種類の助言もしくは推奨であることを意図したものではなく、またこれらに該当するものでもありません。詳細は利用規約をご覧ください。
Ideas I publish are my own. They are not meant to be investment / trading advice. You are encouraged to do your own due diligence.
I am under no obligation to post any action or update to any idea.
Follow me on "X" where I post more content.
I am under no obligation to post any action or update to any idea.
Follow me on "X" where I post more content.
免責事項
これらの情報および投稿は、TradingViewが提供または承認する金融、投資、取引、またはその他の種類の助言もしくは推奨であることを意図したものではなく、またこれらに該当するものでもありません。詳細は利用規約をご覧ください。