
Technical Analysis Summary
Chart Type: Daily (1D)
Ticker: NFLX (Netflix Inc.)
Current Price: $1,194.00 (as of October 16, 2025)
Recent Movement: Down by -0.77%
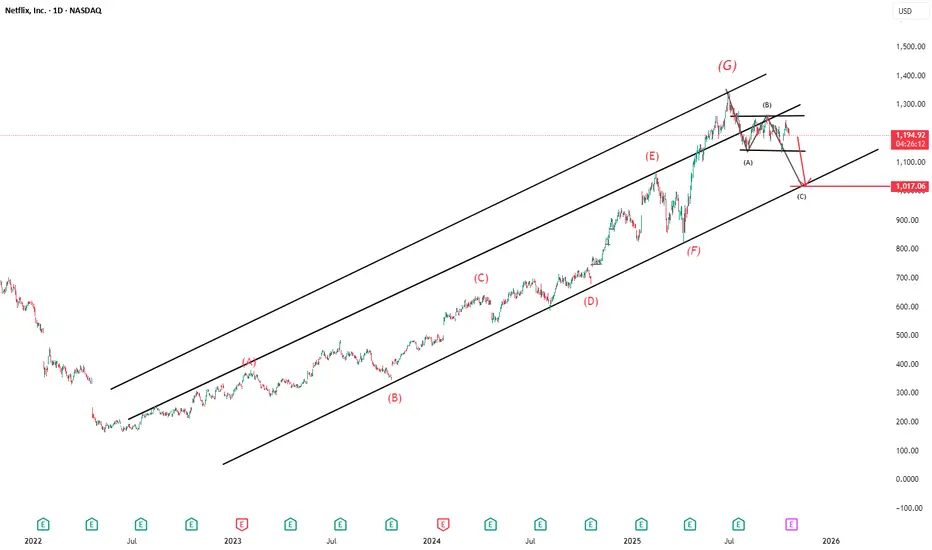
📈 Elliott Wave Labels (in red)
The stock shows a 7-wave impulse move labeled from (A) to (G), forming an upward channel.
The latest top is marked as (G) near $1,450.
A corrective structure appears to be forming post-(G), labeled as (A), (B), (C) in black.
📉 Bearish Outlook
The chart suggests a potential further decline:
From the current level ($1,194) to near $1,107 (short-term support).
Then possibly down to around $1,017 (marked as wave (C)).
📊 Trend Channels
Two parallel ascending channels:
The inner channel guided the move from early 2023 until mid-2025.
The outer channel includes the recent peak at (G), showing possible overextension.
The price has broken below the upper boundary, hinting at a trend change.
Chart Type: Daily (1D)
Ticker: NFLX (Netflix Inc.)
Current Price: $1,194.00 (as of October 16, 2025)
Recent Movement: Down by -0.77%
📈 Elliott Wave Labels (in red)
The stock shows a 7-wave impulse move labeled from (A) to (G), forming an upward channel.
The latest top is marked as (G) near $1,450.
A corrective structure appears to be forming post-(G), labeled as (A), (B), (C) in black.
📉 Bearish Outlook
The chart suggests a potential further decline:
From the current level ($1,194) to near $1,107 (short-term support).
Then possibly down to around $1,017 (marked as wave (C)).
📊 Trend Channels
Two parallel ascending channels:
The inner channel guided the move from early 2023 until mid-2025.
The outer channel includes the recent peak at (G), showing possible overextension.
The price has broken below the upper boundary, hinting at a trend change.

Technical Analyst BY Passion
免責事項
これらの情報および投稿は、TradingViewが提供または承認する金融、投資、取引、またはその他の種類の助言もしくは推奨であることを意図したものではなく、またこれらに該当するものでもありません。詳細は利用規約をご覧ください。
Technical Analyst BY Passion
免責事項
これらの情報および投稿は、TradingViewが提供または承認する金融、投資、取引、またはその他の種類の助言もしくは推奨であることを意図したものではなく、またこれらに該当するものでもありません。詳細は利用規約をご覧ください。