
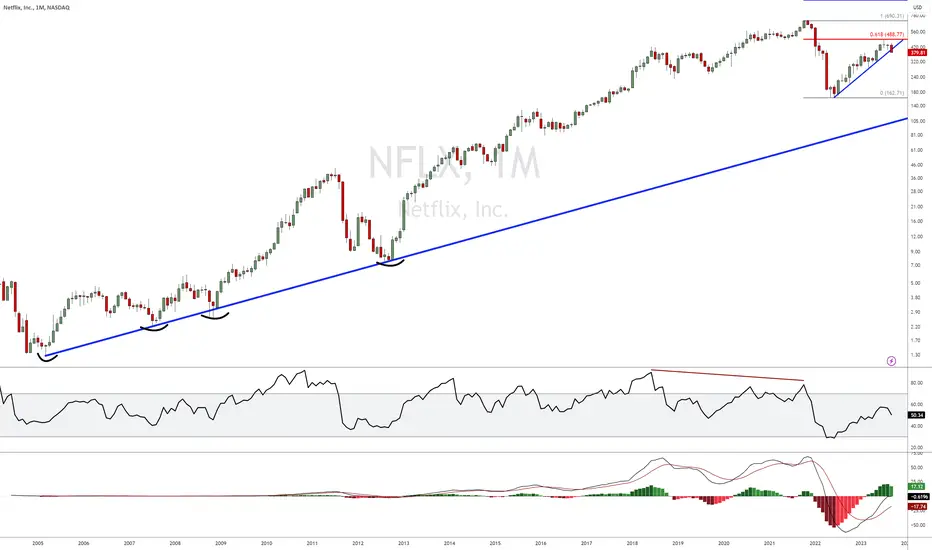
5 trading days to go before the close of the month... which means this last bearish candle that broke the current uptrend can still reverse... let's wait and see.. but currently it is quite bearish... adding the doji that occurred at the .618 Fibonacci retracement level (in red), the RSI not even reaching 60 before reversing and the MACD histogram starting to break down.
Zoom out and NFLX is still on a major long term uptrend... even if the price would drop substantially.
Zoom out and NFLX is still on a major long term uptrend... even if the price would drop substantially.

Charts Avenue
免責事項
これらの情報および投稿は、TradingViewが提供または承認する金融、投資、取引、またはその他の種類の助言もしくは推奨であることを意図したものではなく、またこれらに該当するものでもありません。詳細は利用規約をご覧ください。
Charts Avenue
免責事項
これらの情報および投稿は、TradingViewが提供または承認する金融、投資、取引、またはその他の種類の助言もしくは推奨であることを意図したものではなく、またこれらに該当するものでもありません。詳細は利用規約をご覧ください。