
Market Overview and Key Drivers
Natural gas futures are among the most seasonally sensitive products in the commodity markets, with prices largely driven by predictable demand cycles and unpredictable weather shocks. Demand typically begins to build in late summer, with prices often finding seasonal lows between July and August before rallying into September and October as the market prices in winter heating demand. Volatility generally accelerates from November through February, when cold weather events, storage draws, and forecast revisions can rapidly shift sentiment. As winter demand fades, prices often soften into March and April, followed by a weaker period in May and June as heating demand subsides and storage injections resume.
Beyond seasonality, traders closely monitor weekly EIA storage reports, temperature forecasts measured through heating degree days, production trends, and LNG export flows. Short term price discovery is frequently driven by changes in weather models, while medium term direction is shaped by whether storage levels and production trends confirm or contradict seasonal expectations.
Natural gas does not maintain a consistent correlation with other energy products, as pricing is driven more by regional supply and demand than global macro flows. That said, broader risk sentiment and energy sector positioning can still influence short term price behavior. Volatility remains elevated, especially during winter, when forecast changes can reprice the market quickly.
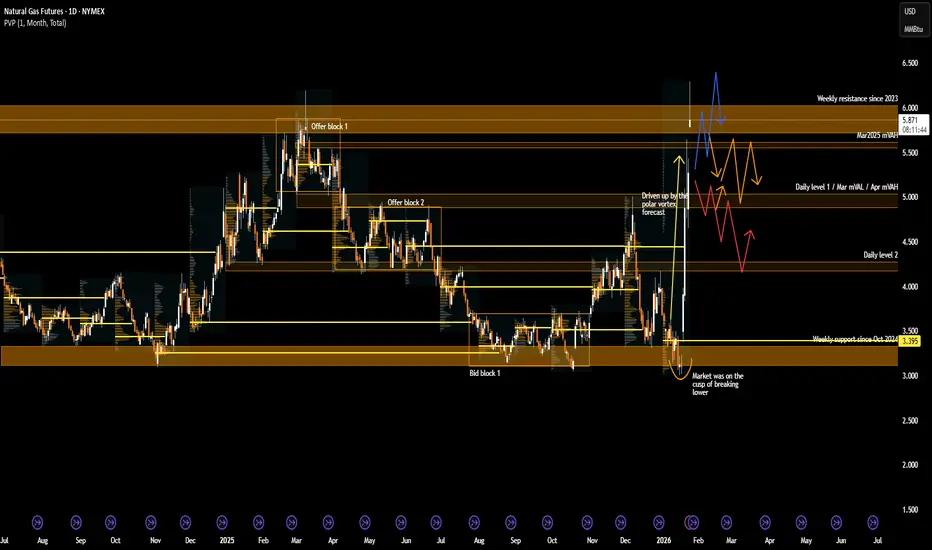
Over the past week, natural gas prices reacted sharply to weather driven headlines. A polar vortex warning across large parts of the United States triggered a surge in short term demand expectations, leading to an aggressive upside move. This rally pushed price into the upper portion of the broader multi-year range.
What the market has done
• The market remains within a larger multi-year range, with clearly defined weekly resistance in the 5.8 to 6.0 area and weekly support near the 3.2 area.
• Since the end of winter in 2025, price has respected a block step trend down, consistently rotating lower after each failed rally attempt.
• The market began its seasonal rally in September, driven by expectations of increased winter heating demand and tightening balances.
• Sellers responded aggressively at the start of December at offer block 2, auctioning price lower and pushing the market back toward the 3.2 weekly support area.
• In the past week, a polar vortex weather warning across the United States triggered a sharp upside spike, driving price toward the 5.6 area, aligning with offer block 1 near the top of the multi-year range and directly into the March 2025 mVAH.
What to expect in the coming weeks
The key level to monitor remains the 5.0 area, which aligns with daily level 1, the March mVAL, and the April mVAH. This zone is likely to act as the primary decision point for both buyers and sellers as the winter season progresses.
Bullish scenario
• If the market holds above the previous week’s close at 5.278, continued momentum could carry price higher toward the 6.0 area.
• The 6.0 level aligns with weekly resistance and the upper boundary of the multi year range.
• Sellers are expected to respond aggressively in this area, potentially leading to rotational or rejection based price action rather than sustained breakout behavior.
Neutral scenario
• Price may balance between the 5.0 area and the 5.75 zone for the remainder of the winter season.
• This range represents a region of prior acceptance, with 5.75 aligning with weekly resistance and the March 2025 mVAH.
• In this scenario, traders should expect two sided trade and rotational behavior rather than directional continuation.
Bearish scenario
• If buyers fail to hold price above the 5.0 area, long liquidation could accelerate.
• A downside move could target the SOC, repairing single prints left behind during the recent weather driven rally.
• Buyers are expected to respond near the 4.47 and 4.25 area, which aligns with the December 2025 VPOC and daily level 2.
Conclusion
Natural gas remains a headline driven market where technical structure and macro fundamentals must be evaluated together. While seasonal demand and extreme weather events continue to support volatility, the broader market remains constrained within a well defined multi year range. From a technical perspective, acceptance or rejection around the 5.0 area will likely dictate whether price continues higher toward weekly resistance or rotates lower to repair unfinished auctions. Fundamentally, traders should remain alert to shifts in weather forecasts, storage trends, and production data, as these factors can quickly invalidate technical setups. As winter unfolds, traders will need to respect the speed of rotations and the market’s tendency to punish late positioning near range extremes.
If you found this analysis helpful, consider sharing your own levels or scenarios and join the discussion.
Disclaimer: This is not financial advice. Analysis is for educational purposes only; trade your own plan and manage risk.
Acronyms:
C - Composite
w - Weekly
m - Monthly
VAH - Value Area High
VAL - Value Area Low
VPOC - Volume Point of Control
LVN - Low Value Node
HVN - High Value Node
LVA - Low Value Area
SP - Single print
Natural gas futures are among the most seasonally sensitive products in the commodity markets, with prices largely driven by predictable demand cycles and unpredictable weather shocks. Demand typically begins to build in late summer, with prices often finding seasonal lows between July and August before rallying into September and October as the market prices in winter heating demand. Volatility generally accelerates from November through February, when cold weather events, storage draws, and forecast revisions can rapidly shift sentiment. As winter demand fades, prices often soften into March and April, followed by a weaker period in May and June as heating demand subsides and storage injections resume.
Beyond seasonality, traders closely monitor weekly EIA storage reports, temperature forecasts measured through heating degree days, production trends, and LNG export flows. Short term price discovery is frequently driven by changes in weather models, while medium term direction is shaped by whether storage levels and production trends confirm or contradict seasonal expectations.
Natural gas does not maintain a consistent correlation with other energy products, as pricing is driven more by regional supply and demand than global macro flows. That said, broader risk sentiment and energy sector positioning can still influence short term price behavior. Volatility remains elevated, especially during winter, when forecast changes can reprice the market quickly.
Over the past week, natural gas prices reacted sharply to weather driven headlines. A polar vortex warning across large parts of the United States triggered a surge in short term demand expectations, leading to an aggressive upside move. This rally pushed price into the upper portion of the broader multi-year range.
What the market has done
• The market remains within a larger multi-year range, with clearly defined weekly resistance in the 5.8 to 6.0 area and weekly support near the 3.2 area.
• Since the end of winter in 2025, price has respected a block step trend down, consistently rotating lower after each failed rally attempt.
• The market began its seasonal rally in September, driven by expectations of increased winter heating demand and tightening balances.
• Sellers responded aggressively at the start of December at offer block 2, auctioning price lower and pushing the market back toward the 3.2 weekly support area.
• In the past week, a polar vortex weather warning across the United States triggered a sharp upside spike, driving price toward the 5.6 area, aligning with offer block 1 near the top of the multi-year range and directly into the March 2025 mVAH.
What to expect in the coming weeks
The key level to monitor remains the 5.0 area, which aligns with daily level 1, the March mVAL, and the April mVAH. This zone is likely to act as the primary decision point for both buyers and sellers as the winter season progresses.
Bullish scenario
• If the market holds above the previous week’s close at 5.278, continued momentum could carry price higher toward the 6.0 area.
• The 6.0 level aligns with weekly resistance and the upper boundary of the multi year range.
• Sellers are expected to respond aggressively in this area, potentially leading to rotational or rejection based price action rather than sustained breakout behavior.
Neutral scenario
• Price may balance between the 5.0 area and the 5.75 zone for the remainder of the winter season.
• This range represents a region of prior acceptance, with 5.75 aligning with weekly resistance and the March 2025 mVAH.
• In this scenario, traders should expect two sided trade and rotational behavior rather than directional continuation.
Bearish scenario
• If buyers fail to hold price above the 5.0 area, long liquidation could accelerate.
• A downside move could target the SOC, repairing single prints left behind during the recent weather driven rally.
• Buyers are expected to respond near the 4.47 and 4.25 area, which aligns with the December 2025 VPOC and daily level 2.
Conclusion
Natural gas remains a headline driven market where technical structure and macro fundamentals must be evaluated together. While seasonal demand and extreme weather events continue to support volatility, the broader market remains constrained within a well defined multi year range. From a technical perspective, acceptance or rejection around the 5.0 area will likely dictate whether price continues higher toward weekly resistance or rotates lower to repair unfinished auctions. Fundamentally, traders should remain alert to shifts in weather forecasts, storage trends, and production data, as these factors can quickly invalidate technical setups. As winter unfolds, traders will need to respect the speed of rotations and the market’s tendency to punish late positioning near range extremes.
If you found this analysis helpful, consider sharing your own levels or scenarios and join the discussion.
Disclaimer: This is not financial advice. Analysis is for educational purposes only; trade your own plan and manage risk.
Acronyms:
C - Composite
w - Weekly
m - Monthly
VAH - Value Area High
VAL - Value Area Low
VPOC - Volume Point of Control
LVN - Low Value Node
HVN - High Value Node
LVA - Low Value Area
SP - Single print

EdgeClear
P: 773.832.8320
Derivatives trading involves a substantial risk of loss. Past performance is not indicative of future results. Any example trades are not inclusive of fees and commissions.
P: 773.832.8320
Derivatives trading involves a substantial risk of loss. Past performance is not indicative of future results. Any example trades are not inclusive of fees and commissions.
免責事項
これらの情報および投稿は、TradingViewが提供または承認する金融、投資、取引、またはその他の種類の助言もしくは推奨であることを意図したものではなく、またこれらに該当するものでもありません。詳細は利用規約をご覧ください。
免責事項
これらの情報および投稿は、TradingViewが提供または承認する金融、投資、取引、またはその他の種類の助言もしくは推奨であることを意図したものではなく、またこれらに該当するものでもありません。詳細は利用規約をご覧ください。