
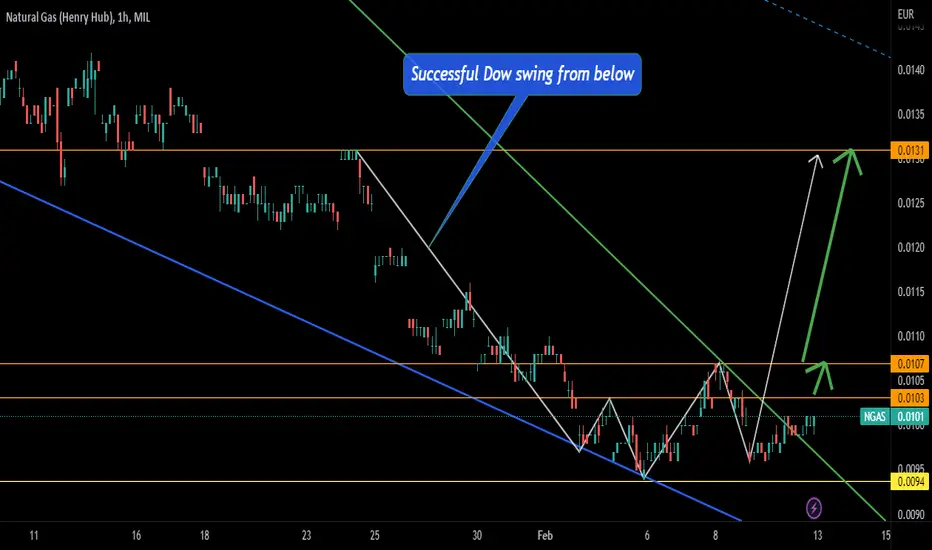
Analysis of natural gas on the hourly chart
= The analysis is based on trend analysis and Dow Laws
= He crossed a downtrend to the top
=Build a successful Dow Swing from the bottom
= Exceeding the level 0.0103 to the top, the targets are 0.0107, then 0.0131
= The analysis is based on trend analysis and Dow Laws
= He crossed a downtrend to the top
=Build a successful Dow Swing from the bottom
= Exceeding the level 0.0103 to the top, the targets are 0.0107, then 0.0131

免責事項
これらの情報および投稿は、TradingViewが提供または承認する金融、投資、取引、またはその他の種類の助言もしくは推奨であることを意図したものではなく、またこれらに該当するものでもありません。詳細は利用規約をご覧ください。
免責事項
これらの情報および投稿は、TradingViewが提供または承認する金融、投資、取引、またはその他の種類の助言もしくは推奨であることを意図したものではなく、またこれらに該当するものでもありません。詳細は利用規約をご覧ください。