
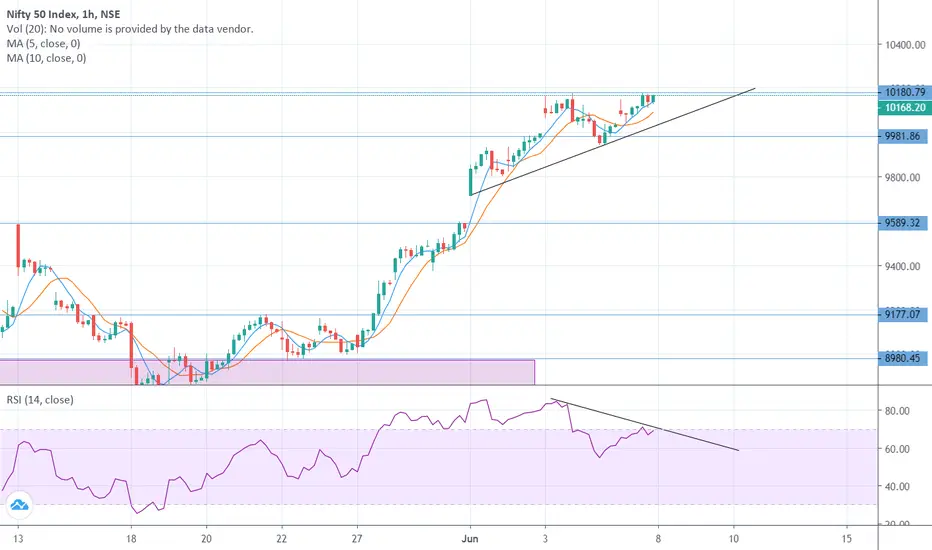
From the hourly chart of Nifty 50, we can clearly see it is making double top pattern, which is a indication of trend reversal. Also, RSI is showing negative divergence which implies that the Nifty can slide down. Nifty is at strong resistance level. We have to keep checking how it behaves on Monday, and with the confirmation of trend reversal we can short for good profits.
Shorting after the trend line (shown in image) breaks will be a good opportunity. Keep an eye on it on Monday 8th of June 2020.
Shorting after the trend line (shown in image) breaks will be a good opportunity. Keep an eye on it on Monday 8th of June 2020.
ノート
Also, Nifty can make Double top pattern.
免責事項
これらの情報および投稿は、TradingViewが提供または承認する金融、投資、取引、またはその他の種類の助言もしくは推奨であることを意図したものではなく、またこれらに該当するものでもありません。詳細は利用規約をご覧ください。
免責事項
これらの情報および投稿は、TradingViewが提供または承認する金融、投資、取引、またはその他の種類の助言もしくは推奨であることを意図したものではなく、またこれらに該当するものでもありません。詳細は利用規約をご覧ください。