
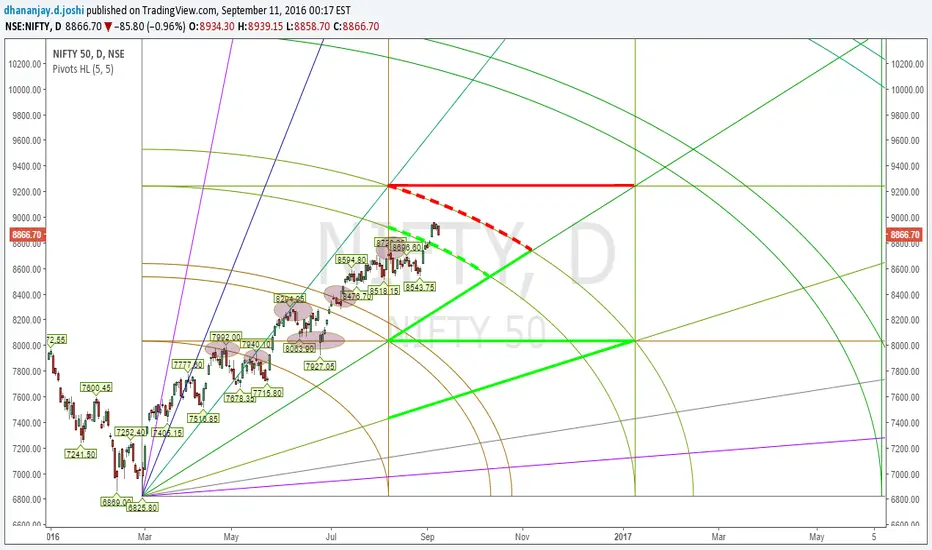
This is not a trading idea, sharing this road map to share possible future moves of NIFTY.
I have applied the Gann toll on weekly chart, on daily chart we can see that price is responding to tool's lines and curves. We can hope in future also price will respect the tool :-) . We can use such charts not to trade but to take overall idea and use the lines or curves to exit or part booking of profits.
Have added Pivot indicator in chart, I am using indicator not for pivot trading but to bring objectivity in identifying price ore market structure. This (structure analysis)can be used individually or with any other analysis.
The old analysis with demand and supply zone is attached in idea.

関連の投稿
免責事項
これらの情報および投稿は、TradingViewが提供または承認する金融、投資、取引、またはその他の種類の助言もしくは推奨であることを意図したものではなく、またこれらに該当するものでもありません。詳細は利用規約をご覧ください。
免責事項
これらの情報および投稿は、TradingViewが提供または承認する金融、投資、取引、またはその他の種類の助言もしくは推奨であることを意図したものではなく、またこれらに該当するものでもありません。詳細は利用規約をご覧ください。