
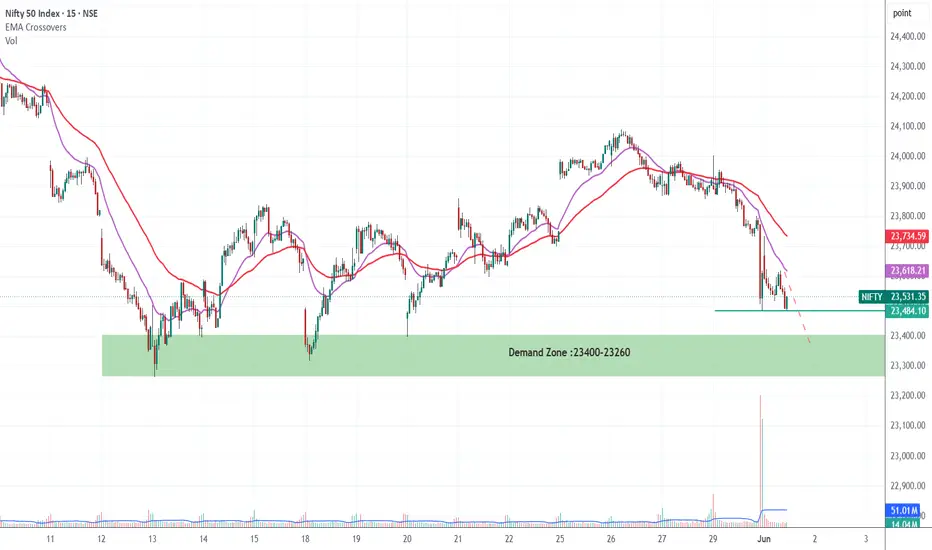
NIFTY is showing weakness on the 15-minute chart, hourly chart even daily chart as price continues trading below both EMAs, indicating bearish momentum. A sharp breakdown with strong volume confirms seller dominance, while the 23400–23260 demand zone is now the key area to watch. If buyers defend this zone, a short-term bounce is possible, but a breakdown below it may trigger further downside pressure.
トレード稼働中
Now Nifty Entered into Demand Zone, it may remain Sidways for sometimeトレード終了: 利益確定目標に到達

免責事項
これらの情報および投稿は、TradingViewが提供または承認する金融、投資、取引、またはその他の種類の助言もしくは推奨であることを意図したものではなく、またこれらに該当するものでもありません。詳細は利用規約をご覧ください。
免責事項
これらの情報および投稿は、TradingViewが提供または承認する金融、投資、取引、またはその他の種類の助言もしくは推奨であることを意図したものではなく、またこれらに該当するものでもありません。詳細は利用規約をご覧ください。