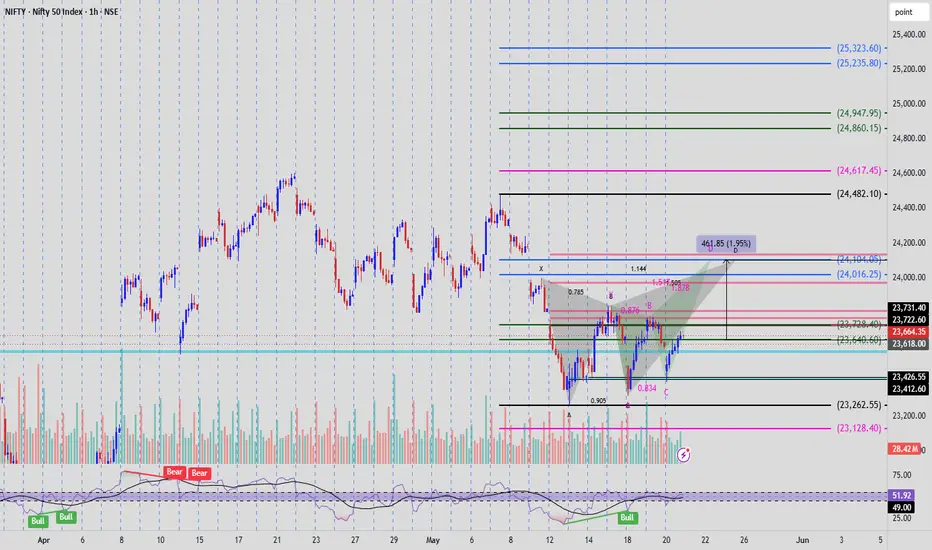
 NIFTY
Current Market Structure
Spot Level
NIFTY Close: 23,664.35
RSI (14): 62.27 (bullish momentum) - 5M Chart
Price is trading above short-term support and recovering from point C.
Support Zones
23,640
23,618
23,462
23,262 (major swing support)
Resistance Zones
23,728 – 23,800
24,016
24,104 (Pattern D / final target)
24,482 (higher breakout target)
Harmonic Projection
The green projection indicates price moving from the current region toward point D.
Expected Upside
Current Price: 23,664
Target D: 24,104
Projected Gain: ≈ 462 points (+1.95%)
Trading Interpretation
Bullish Scenario
If NIFTY sustains above 23,640–23,618, the harmonic setup remains valid and price can advance toward:
23,800
24,016
24,104 (Primary Harmonic Target)
Invalidation
A decisive break below 23,618 weakens the structure.
A fall below 23,462 would invalidate the bullish setup.
RSI Confirmation
Current RSI above 50
Recent bullish crossover
Positive momentum building
This supports the bullish harmonic thesis.
トレード稼働中
We were able to capture all 450 points from our entry levels. Trade done. Next will be from 23,700 to 24,200

免責事項
これらの情報および投稿は、TradingViewが提供または承認する金融、投資、取引、またはその他の種類の助言もしくは推奨であることを意図したものではなく、またこれらに該当するものでもありません。詳細は利用規約をご覧ください。
免責事項
これらの情報および投稿は、TradingViewが提供または承認する金融、投資、取引、またはその他の種類の助言もしくは推奨であることを意図したものではなく、またこれらに該当するものでもありません。詳細は利用規約をご覧ください。