
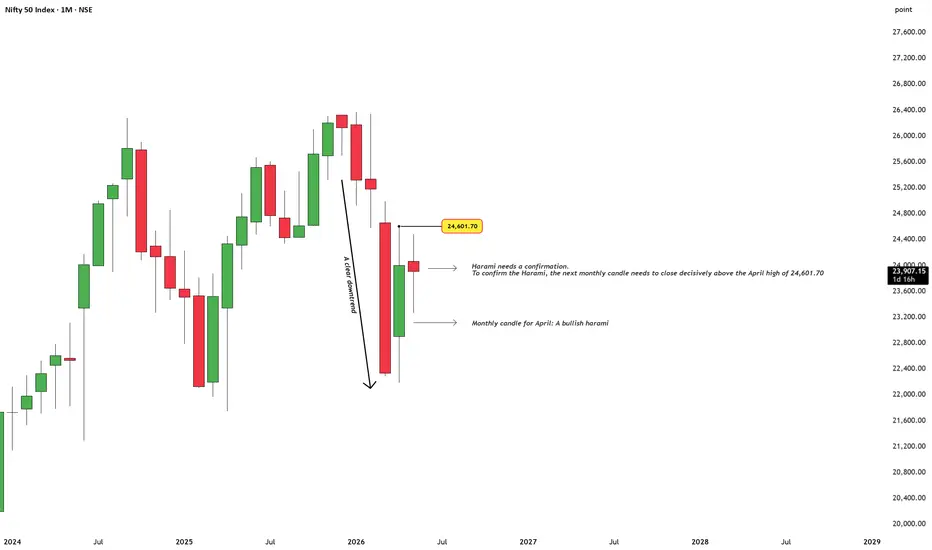
Let's look at the Nifty monthly chart. After a rough start to 2026, the market is giving us a classic candlestick pattern right at a critical macro level: a potential Bullish Harami.
For anyone new to the pattern, "Harami" is just the Japanese word for pregnant. Structurally, it's pretty literal. Look at the March candle—it's a massive, aggressive red bar (the mother). Then look at the April candle—it's a much smaller green bar (the baby) whose entire body sits comfortably inside March's range.
When you see this happen after a clear downtrend, it tells you one thing: the selling momentum has suddenly stalled. The bears couldn't push prices lower, and the bulls managed to force a quiet pause.
Confirmation:
In trading, a Harami on its own is just a warning light, not a green light to buy. According to strict Japanese candlestick rules, a Bullish Harami is only validated when the next candle closes decisively above the high of that second (April) candle i.e. 24,601.70.
Look at the current May candle. It tried to push up earlier this month, faced some heavy resistance, and is currently trading in the red around 23,907. Under normal market conditions, with only Friday's session left in May, it is virtually impossible to expect the massive 700-point miracle surge needed to clear that trigger line.
The Geopolitical Wildcard
But here is where things get interesting. Tomorrow (Thursday) is a market holiday, and we are sitting on a constant stream of volatile headlines coming out of the Middle East. With Indian stock exchanges shut for the day, global markets will keep moving.
This sets up a fascinating "what-if" scenario. Any sudden, unexpectedly positive breakthrough or major de-escalation news on the geopolitical front over the holiday could completely rewrite the script overnight. Could a massive wave of global relief trigger a rare, explosive 3% gap-up or historic single-day rally on Friday to confirm this Harami at the absolute final second?
However, a cautious tone is highly warranted here. Disciplined traders don't risk capital gambling on holiday miracles or chasing morning hype. If a massive geopolitical gap-up does happen on Friday, the only thing that actually matters is where the closing bell rings at 3:30 PM. A spike that fails to sustain is just a trap.
So, what's the game plan?
Assuming the market behaves rationally, May will likely close without confirmation. The setup doesn't die; it just passes the torch to June.
Disclaimer: This post is for educational purposes only and does not constitute financial advice or buy/sell recommendations. I am not a SEBI-registered advisor. Please do your own research and manage your risk strictly according to your capital layout before taking any positions.
For anyone new to the pattern, "Harami" is just the Japanese word for pregnant. Structurally, it's pretty literal. Look at the March candle—it's a massive, aggressive red bar (the mother). Then look at the April candle—it's a much smaller green bar (the baby) whose entire body sits comfortably inside March's range.
When you see this happen after a clear downtrend, it tells you one thing: the selling momentum has suddenly stalled. The bears couldn't push prices lower, and the bulls managed to force a quiet pause.
Confirmation:
In trading, a Harami on its own is just a warning light, not a green light to buy. According to strict Japanese candlestick rules, a Bullish Harami is only validated when the next candle closes decisively above the high of that second (April) candle i.e. 24,601.70.
Look at the current May candle. It tried to push up earlier this month, faced some heavy resistance, and is currently trading in the red around 23,907. Under normal market conditions, with only Friday's session left in May, it is virtually impossible to expect the massive 700-point miracle surge needed to clear that trigger line.
The Geopolitical Wildcard
But here is where things get interesting. Tomorrow (Thursday) is a market holiday, and we are sitting on a constant stream of volatile headlines coming out of the Middle East. With Indian stock exchanges shut for the day, global markets will keep moving.
This sets up a fascinating "what-if" scenario. Any sudden, unexpectedly positive breakthrough or major de-escalation news on the geopolitical front over the holiday could completely rewrite the script overnight. Could a massive wave of global relief trigger a rare, explosive 3% gap-up or historic single-day rally on Friday to confirm this Harami at the absolute final second?
However, a cautious tone is highly warranted here. Disciplined traders don't risk capital gambling on holiday miracles or chasing morning hype. If a massive geopolitical gap-up does happen on Friday, the only thing that actually matters is where the closing bell rings at 3:30 PM. A spike that fails to sustain is just a trap.
So, what's the game plan?
Assuming the market behaves rationally, May will likely close without confirmation. The setup doesn't die; it just passes the torch to June.
- The Trigger: We wait to see if the June candle can bring the necessary volume to break out and close decisively above 24,601.70.
- The Safety Net: A standard conservative stop-loss goes just below the lowest point of the entire structure—the March low. If the market slips below that floor, the pattern fails completely, and the downtrend is back on.
- Managing the Volatility: Because we are looking at a Monthly (1M) chart, the volatility and the distance to that stop-loss are absolutely massive. Trying to tighten your stop-loss right under the baby candle is a trap; you'll just get shaken out by random market noise. The smartest way to manage this risk is simply to lower your position size (buy fewer units or lots). By risking less capital per point, you give the trade the breathing room it needs to play out over the 3 to 6 months this macro move might take to climb back toward the 26,000+ resistance zone.
Disclaimer: This post is for educational purposes only and does not constitute financial advice or buy/sell recommendations. I am not a SEBI-registered advisor. Please do your own research and manage your risk strictly according to your capital layout before taking any positions.

WaveXplorer | Elliott Wave insights
📊 X profile: @veerappa89
📊 X profile: @veerappa89
関連の投稿
免責事項
これらの情報および投稿は、TradingViewが提供または承認する金融、投資、取引、またはその他の種類の助言もしくは推奨であることを意図したものではなく、またこれらに該当するものでもありません。詳細は利用規約をご覧ください。
WaveXplorer | Elliott Wave insights
📊 X profile: @veerappa89
📊 X profile: @veerappa89
関連の投稿
免責事項
これらの情報および投稿は、TradingViewが提供または承認する金融、投資、取引、またはその他の種類の助言もしくは推奨であることを意図したものではなく、またこれらに該当するものでもありません。詳細は利用規約をご覧ください。