
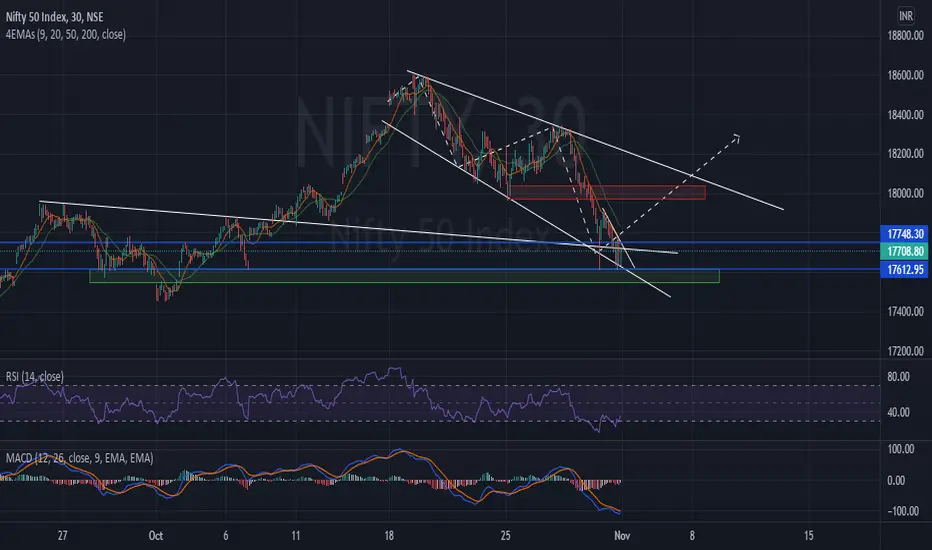
The Chart is self explanatory by itself.
Green rectangle - Demand Zone
Red rectangle - Supply Zone
Space between the two blue lines will be considered as no trading zone by me.
Please LIKE,COMMENT and SHARE the idea to keep me motivated so I can keep on further analysing potential Indices and stock trades for you.
Green rectangle - Demand Zone
Red rectangle - Supply Zone
Space between the two blue lines will be considered as no trading zone by me.
Please LIKE,COMMENT and SHARE the idea to keep me motivated so I can keep on further analysing potential Indices and stock trades for you.
トレード稼働中
So as given in the analysis nifty showed a good move toward the upper side till it reached the resistance level already drawn. The trade is working perfectly and we made a really good profit in ce side.People can book here or hold as per their risk appetite.
Next will be trying to buy more on slight retracement if there is any.
Godspeed.
トレード終了: 利益確定目標に到達
Target reachedトレード終了: 利益確定目標に到達
All targets done brake-out given.Godspeed

関連の投稿
免責事項
これらの情報および投稿は、TradingViewが提供または承認する金融、投資、取引、またはその他の種類の助言もしくは推奨であることを意図したものではなく、またこれらに該当するものでもありません。詳細は利用規約をご覧ください。
関連の投稿
免責事項
これらの情報および投稿は、TradingViewが提供または承認する金融、投資、取引、またはその他の種類の助言もしくは推奨であることを意図したものではなく、またこれらに該当するものでもありません。詳細は利用規約をご覧ください。