
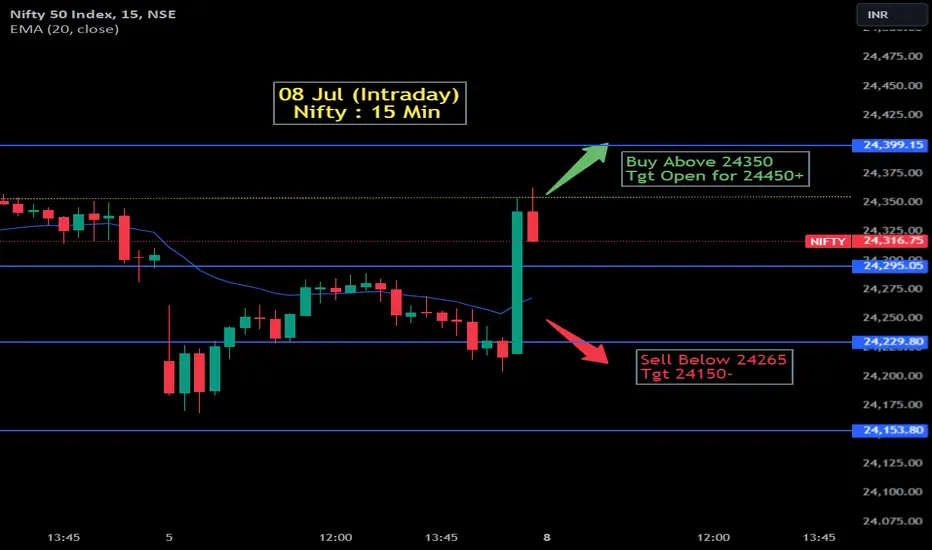
It looks like you have provided a trading chart for Nifty 50 Index with specific trading signals for July 8th. Here are the key details from the chart:
Buy Signal:
-Trigger: Above 24,350
-Target: Open for 24,450+
Sell Signal:
-Trigger: Below 24,265
-Target: 24,150-
The chart uses a 15-minute timeframe and shows the price action along with an EMA (20) indicator.
Buy Signal:
-Trigger: Above 24,350
-Target: Open for 24,450+
Sell Signal:
-Trigger: Below 24,265
-Target: 24,150-
The chart uses a 15-minute timeframe and shows the price action along with an EMA (20) indicator.

免責事項
これらの情報および投稿は、TradingViewが提供または承認する金融、投資、取引、またはその他の種類の助言もしくは推奨であることを意図したものではなく、またこれらに該当するものでもありません。詳細は利用規約をご覧ください。
免責事項
これらの情報および投稿は、TradingViewが提供または承認する金融、投資、取引、またはその他の種類の助言もしくは推奨であることを意図したものではなく、またこれらに該当するものでもありません。詳細は利用規約をご覧ください。