
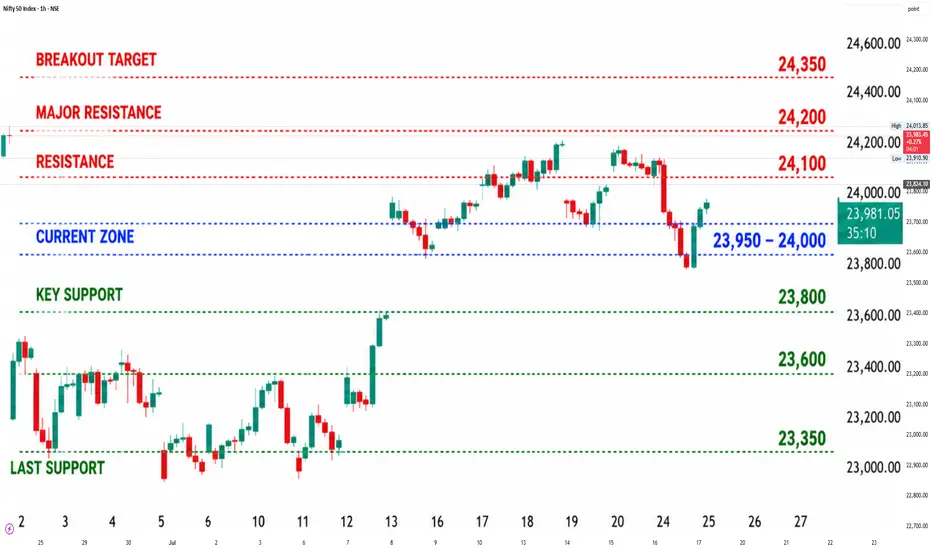
Current Zone: 23,950–24,000 area is the key battleground. Nifty recovered from recent weakness but is still facing resistance around 24,000–24,200.
Important Levels
Resistance Zones
24,000 (Immediate hurdle)
24,100–24,200 (Major resistance)
24,300–24,350 (Bullish breakout target)
Support Zones
23,800 (Key support)
23,650–23,600 (Strong support)
23,400–23,350 (Last bullish defense)
Trading Plan
Bullish Scenario
Sustained move above 24,000
Target: 24,100 → 24,200
Strong breakout above 24,200 can extend towards 24,300–24,350.
Bearish Scenario
Break below 23,800
Target: 23,650 → 23,600
Further weakness may drag Nifty towards 23,400–23,350.
Swing Trader View
Above 24,000: Positive bias
Below 23,800: Cautious / bearish bias
Range-bound zone: 23,800–24,000.
Chart Setup Text (for your TradingView-style chart)
RESISTANCE: 24,200
MAJOR RESISTANCE: 24,100–24,200
BREAKOUT TARGET: 24,350
CURRENT ZONE: 23,950–24,000
KEY SUPPORT: 23,800
STRONG SUPPORT: 23,600
LAST SUPPORT: 23,350
BIAS: Bullish above 24,000 | Bearish below 23,800

関連の投稿
免責事項
これらの情報および投稿は、TradingViewが提供または承認する金融、投資、取引、またはその他の種類の助言もしくは推奨であることを意図したものではなく、またこれらに該当するものでもありません。詳細は利用規約をご覧ください。
関連の投稿
免責事項
これらの情報および投稿は、TradingViewが提供または承認する金融、投資、取引、またはその他の種類の助言もしくは推奨であることを意図したものではなく、またこれらに該当するものでもありません。詳細は利用規約をご覧ください。