
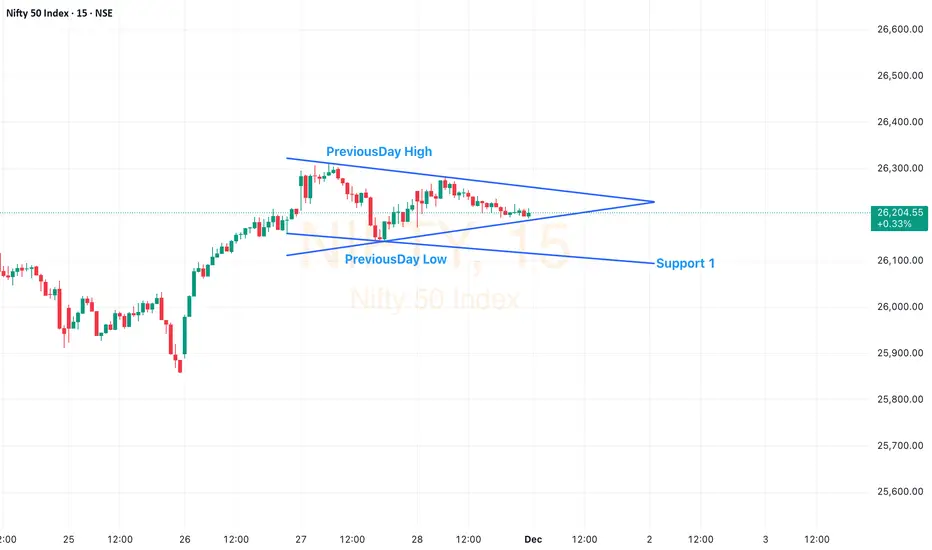
Trading plan:
Gap Up: Wait for pullback → bullish confirmation → long.
Gap Down: Wait for retest → bearish confirmation → short.
Flat Open: Let the triangle breakout guide direction.
Keep SL outside the structure and avoid overtrading inside the triangle.
1️⃣ If Market Opens GAP UP (100–150 points above)
Bias: Bullish but avoid chasing the price. Plan:
Wait for a pullback toward
Previous Day High
Triangle resistance
Any intraday support
Look for bullish price action:
Bullish engulfing
Hammer
Reversal candle with volume
Enter long only after confirmation. SL below the pullback low.
2️⃣ If Market Opens GAP DOWN
Bias: Bearish Plan:
Allow price to retest the lower boundary (previous day low or Support 1).
Enter shorts only on a clean rejection with bearish confirmation.
3️⃣ If Market Opens FLAT (within yesterday’s range)
Bias: Neutral → wait for breakout Plan:
Price is inside the triangle, so expect consolidation.
Trade only after a breakout or breakdown of the pattern.
Breakout above triangle = bullish long.
Breakdown below triangle = bearish short.
Volume confirmation required.
SL outside the triangle opposite side.
Gap Up: Wait for pullback → bullish confirmation → long.
Gap Down: Wait for retest → bearish confirmation → short.
Flat Open: Let the triangle breakout guide direction.
Keep SL outside the structure and avoid overtrading inside the triangle.
1️⃣ If Market Opens GAP UP (100–150 points above)
Bias: Bullish but avoid chasing the price. Plan:
Wait for a pullback toward
Previous Day High
Triangle resistance
Any intraday support
Look for bullish price action:
Bullish engulfing
Hammer
Reversal candle with volume
Enter long only after confirmation. SL below the pullback low.
2️⃣ If Market Opens GAP DOWN
Bias: Bearish Plan:
Allow price to retest the lower boundary (previous day low or Support 1).
Enter shorts only on a clean rejection with bearish confirmation.
3️⃣ If Market Opens FLAT (within yesterday’s range)
Bias: Neutral → wait for breakout Plan:
Price is inside the triangle, so expect consolidation.
Trade only after a breakout or breakdown of the pattern.
Breakout above triangle = bullish long.
Breakdown below triangle = bearish short.
Volume confirmation required.
SL outside the triangle opposite side.
ノート
Market open gap up bullish but no strength First 5 Min candle was bearish with good volume so sold CALL option.
I do option selling as it help me to manage my risk properly and get profit in case of Theta Decay.

免責事項
これらの情報および投稿は、TradingViewが提供または承認する金融、投資、取引、またはその他の種類の助言もしくは推奨であることを意図したものではなく、またこれらに該当するものでもありません。詳細は利用規約をご覧ください。
免責事項
これらの情報および投稿は、TradingViewが提供または承認する金融、投資、取引、またはその他の種類の助言もしくは推奨であることを意図したものではなく、またこれらに該当するものでもありません。詳細は利用規約をご覧ください。