
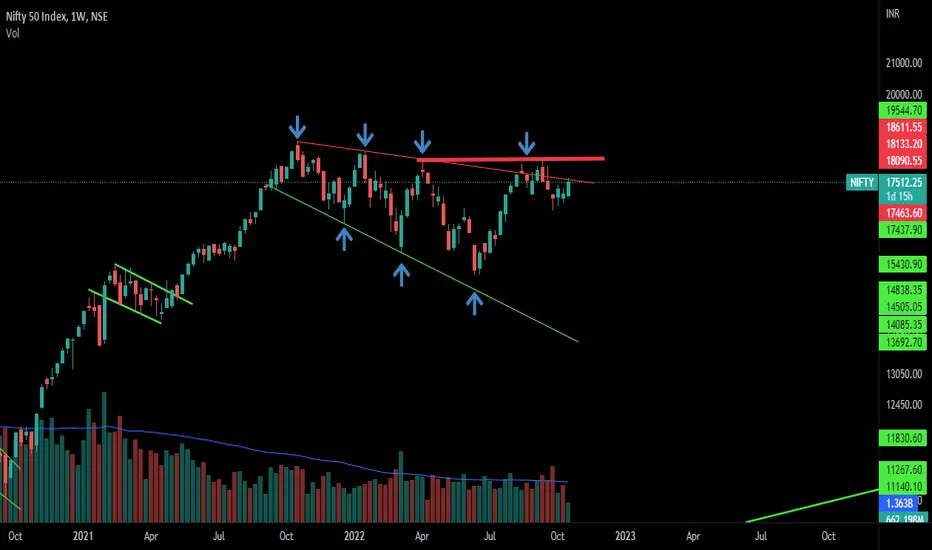
A trendline from the last year's 2021 October highs is where Nifty is facing resistance right now.
Once this is crossed then the immediate resistance will be recent highs which is at 18100.
If it couldn't sustain then Nifty might see 16300 again.
This week's closing candle can give us a clear picture of the upcoming Nifty move.
Watch out for upcoming moves.
Once this is crossed then the immediate resistance will be recent highs which is at 18100.
If it couldn't sustain then Nifty might see 16300 again.
This week's closing candle can give us a clear picture of the upcoming Nifty move.
Watch out for upcoming moves.

GK_Cheerla
免責事項
これらの情報および投稿は、TradingViewが提供または承認する金融、投資、取引、またはその他の種類の助言もしくは推奨であることを意図したものではなく、またこれらに該当するものでもありません。詳細は利用規約をご覧ください。
GK_Cheerla
免責事項
これらの情報および投稿は、TradingViewが提供または承認する金融、投資、取引、またはその他の種類の助言もしくは推奨であることを意図したものではなく、またこれらに該当するものでもありません。詳細は利用規約をご覧ください。