
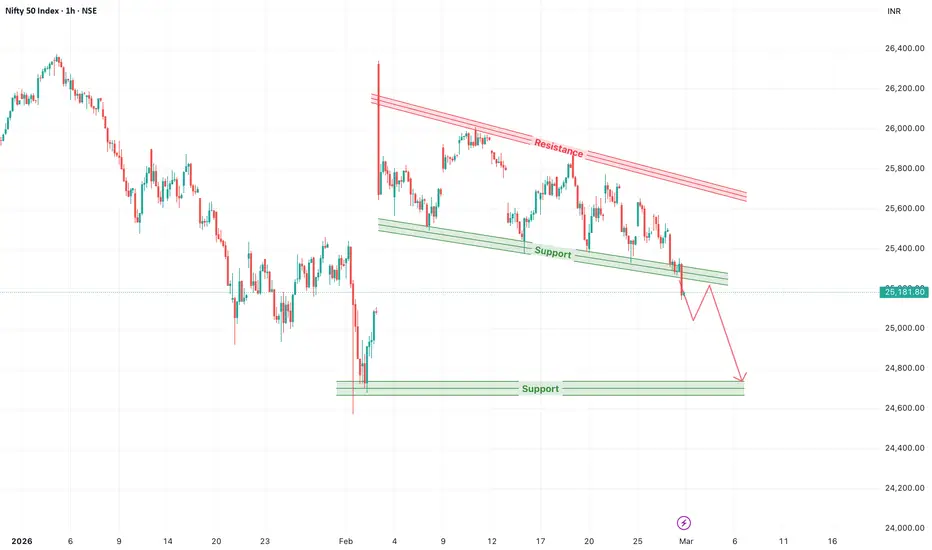
Nifty’s current price action cannot be viewed in isolation. The index is trading under visible technical pressure at the same time that global geopolitical risk has intensified following the escalating Iran–Israel conflict. When macro uncertainty rises sharply, markets typically shift into a risk-off mode — and that context matters significantly for interpreting the chart.
From a technical standpoint, the 1-hour structure shows a clear pattern of lower highs beneath a descending resistance trendline. Every recovery attempt has been capped by supply, indicating that sellers are active on rallies. More importantly, price has slipped below its short-term rising support channel. That breakdown weakens the immediate bullish structure and increases the probability of a rotation toward deeper horizontal demand near the 24,700–24,800 zone.
Now layer in the macro backdrop. Escalation in the Middle East has triggered concerns around crude oil supply disruptions, particularly involving key shipping routes. For India, which is heavily dependent on imported crude, rising oil prices translate directly into inflationary pressure, currency stress, and potential margin compression for companies. Higher energy costs tend to weigh on consumption, corporate earnings expectations, and foreign institutional flows — all of which impact Nifty components.
In risk-off environments, institutional money typically reduces exposure to equities and reallocates toward defensive assets like gold or cash. That shift in capital flow often amplifies technical breakdowns. So the recent slip below support on Nifty is not just a chart event — it aligns with broader macro-driven caution.
However, markets rarely move in straight lines. If geopolitical tensions stabilize or crude prices cool off, sentiment can shift quickly. Technically, Nifty would need to reclaim the broken support zone and move back above the 25,250–25,300 region to invalidate the immediate bearish bias. A sustained recovery above that level could trigger short covering and a push toward the descending resistance near 25,800–26,000.
On the downside, failure to reclaim structure keeps pressure intact. In that case, the next logical magnet remains the 24,700–24,800 demand cluster. A decisive break below that would indicate broader weakness and potentially open the door to a deeper corrective leg.
In summary, the chart shows a weakening short-term structure, and the macro environment is not providing relief. Until price reclaims lost levels, bias remains cautiously bearish. The coming sessions will likely be driven by headlines as much as technical levels, making disciplined risk management more important than directional conviction.
From a technical standpoint, the 1-hour structure shows a clear pattern of lower highs beneath a descending resistance trendline. Every recovery attempt has been capped by supply, indicating that sellers are active on rallies. More importantly, price has slipped below its short-term rising support channel. That breakdown weakens the immediate bullish structure and increases the probability of a rotation toward deeper horizontal demand near the 24,700–24,800 zone.
Now layer in the macro backdrop. Escalation in the Middle East has triggered concerns around crude oil supply disruptions, particularly involving key shipping routes. For India, which is heavily dependent on imported crude, rising oil prices translate directly into inflationary pressure, currency stress, and potential margin compression for companies. Higher energy costs tend to weigh on consumption, corporate earnings expectations, and foreign institutional flows — all of which impact Nifty components.
In risk-off environments, institutional money typically reduces exposure to equities and reallocates toward defensive assets like gold or cash. That shift in capital flow often amplifies technical breakdowns. So the recent slip below support on Nifty is not just a chart event — it aligns with broader macro-driven caution.
However, markets rarely move in straight lines. If geopolitical tensions stabilize or crude prices cool off, sentiment can shift quickly. Technically, Nifty would need to reclaim the broken support zone and move back above the 25,250–25,300 region to invalidate the immediate bearish bias. A sustained recovery above that level could trigger short covering and a push toward the descending resistance near 25,800–26,000.
On the downside, failure to reclaim structure keeps pressure intact. In that case, the next logical magnet remains the 24,700–24,800 demand cluster. A decisive break below that would indicate broader weakness and potentially open the door to a deeper corrective leg.
In summary, the chart shows a weakening short-term structure, and the macro environment is not providing relief. Until price reclaims lost levels, bias remains cautiously bearish. The coming sessions will likely be driven by headlines as much as technical levels, making disciplined risk management more important than directional conviction.

📈 Trade Smarter with TradZoo!
📣 Telegram: t.me/tradzooIndex
📣 Forex Telegram: t.me/tradzoofx
📲 Mobile App: tradzoo.com/download
📲 Forex App:tradzoo.com/forex/download
🔗 Website: bit.ly/tradzoopage
📣 Telegram: t.me/tradzooIndex
📣 Forex Telegram: t.me/tradzoofx
📲 Mobile App: tradzoo.com/download
📲 Forex App:tradzoo.com/forex/download
🔗 Website: bit.ly/tradzoopage
免責事項
これらの情報および投稿は、TradingViewが提供または承認する金融、投資、取引、またはその他の種類の助言もしくは推奨であることを意図したものではなく、またこれらに該当するものでもありません。詳細は利用規約をご覧ください。
📈 Trade Smarter with TradZoo!
📣 Telegram: t.me/tradzooIndex
📣 Forex Telegram: t.me/tradzoofx
📲 Mobile App: tradzoo.com/download
📲 Forex App:tradzoo.com/forex/download
🔗 Website: bit.ly/tradzoopage
📣 Telegram: t.me/tradzooIndex
📣 Forex Telegram: t.me/tradzoofx
📲 Mobile App: tradzoo.com/download
📲 Forex App:tradzoo.com/forex/download
🔗 Website: bit.ly/tradzoopage
免責事項
これらの情報および投稿は、TradingViewが提供または承認する金融、投資、取引、またはその他の種類の助言もしくは推奨であることを意図したものではなく、またこれらに該当するものでもありません。詳細は利用規約をご覧ください。