
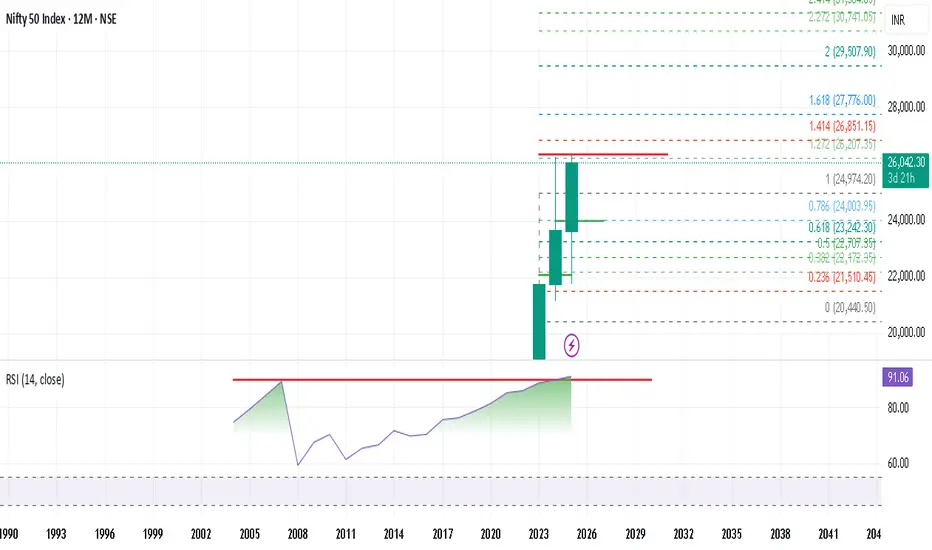
Nifty 50 wrapped up the week at 26042, gaining +76 points from last week’s close after hitting a high of 26236 and low of 26008. As highlighted earlier, the index continues to trade within my broader zone of 26500–25400, showing no decisive breakout yet. This week’s Gravestone Doji candle formation signals buyer exhaustion and potential weakness, with price closing near the weekly lows — never a great sign for bullish momentum.
With FII participation still muted due to holiday season and India VIX resting at a calm 9.15, volatility may stay compressed, suggesting range-bound or slow movement in the coming week unless major triggers appear.
Nifty Weekly Range Expectation: 26400–25700
A breakout beyond this range may bring sharp moves (“fireworks”) in either direction.
For upside continuation, Nifty must close above 26200 for two consecutive sessions, which could open targets toward 26277 / 26325 / 26400.
BankNifty Outlook
BankNifty ended at 59011, down just -50 points, but importantly closed near the weekly low, hinting at possible sell pressure ahead. If weakness persists, we may see tests of key supports:
Support Levels: 58700 / 58300 / 57600
Break of these zones can drag Nifty along with it.
For bulls to reclaim control, we need a sustained close above 59300, which may drive a move toward 59755 / 60000.
Expected Range: 59900–58200
Global Cue – S&P 500 Breaks Out to New All-Time Highs
S&P500 delivered a powerful move this week, breaking above the 6882 resistance and closing at an all-time high of 6930. The chart structure suggests a march toward the next Fibonacci level at 7026. However — monthly timeframe RSI is nearing the overbought zone, which historically calls for caution, trailing stop-losses, or partial profit booking for US equity investors.
Historical Reminder for Long-Term Investors
Nifty’s yearly RSI previously hit 91 only once before — Jan 2008.
Within months, the market corrected over 60% from the highs.
Today again, RSI on yearly frame is heating up. Coincidence or caution?
History doesn’t repeat, but it often rhymes.
Key levels to watch in 2026 based on price behaviour around yearly candle:
🔻 Break below December low → a deeper correction could unfold
🔼 Break above December high → Nifty may climb toward 27824/29156 before any major decline
Markets reward those who prepare – not predict.
Final Take
Nifty & BankNifty locked in range → wait for break + confirmation
Volatility low = breakout moves may be strong when they come
S&P500 bullish but nearing overbought territory
Keep risk management tight, trail profits & prepare for both outcomes
Is history about to repeat?
We’ll know soon — until then, stay alert, stay hedged, and stay disciplined.
With FII participation still muted due to holiday season and India VIX resting at a calm 9.15, volatility may stay compressed, suggesting range-bound or slow movement in the coming week unless major triggers appear.
Nifty Weekly Range Expectation: 26400–25700
A breakout beyond this range may bring sharp moves (“fireworks”) in either direction.
For upside continuation, Nifty must close above 26200 for two consecutive sessions, which could open targets toward 26277 / 26325 / 26400.
BankNifty Outlook
BankNifty ended at 59011, down just -50 points, but importantly closed near the weekly low, hinting at possible sell pressure ahead. If weakness persists, we may see tests of key supports:
Support Levels: 58700 / 58300 / 57600
Break of these zones can drag Nifty along with it.
For bulls to reclaim control, we need a sustained close above 59300, which may drive a move toward 59755 / 60000.
Expected Range: 59900–58200
Global Cue – S&P 500 Breaks Out to New All-Time Highs
S&P500 delivered a powerful move this week, breaking above the 6882 resistance and closing at an all-time high of 6930. The chart structure suggests a march toward the next Fibonacci level at 7026. However — monthly timeframe RSI is nearing the overbought zone, which historically calls for caution, trailing stop-losses, or partial profit booking for US equity investors.
Historical Reminder for Long-Term Investors
Nifty’s yearly RSI previously hit 91 only once before — Jan 2008.
Within months, the market corrected over 60% from the highs.
Today again, RSI on yearly frame is heating up. Coincidence or caution?
History doesn’t repeat, but it often rhymes.
Key levels to watch in 2026 based on price behaviour around yearly candle:
🔻 Break below December low → a deeper correction could unfold
🔼 Break above December high → Nifty may climb toward 27824/29156 before any major decline
Markets reward those who prepare – not predict.
Final Take
Nifty & BankNifty locked in range → wait for break + confirmation
Volatility low = breakout moves may be strong when they come
S&P500 bullish but nearing overbought territory
Keep risk management tight, trail profits & prepare for both outcomes
Is history about to repeat?
We’ll know soon — until then, stay alert, stay hedged, and stay disciplined.

免責事項
これらの情報および投稿は、TradingViewが提供または承認する金融、投資、取引、またはその他の種類の助言もしくは推奨であることを意図したものではなく、またこれらに該当するものでもありません。詳細は利用規約をご覧ください。
免責事項
これらの情報および投稿は、TradingViewが提供または承認する金融、投資、取引、またはその他の種類の助言もしくは推奨であることを意図したものではなく、またこれらに該当するものでもありません。詳細は利用規約をご覧ください。