
Time has always been a critical element in W.D. Gann’s work.
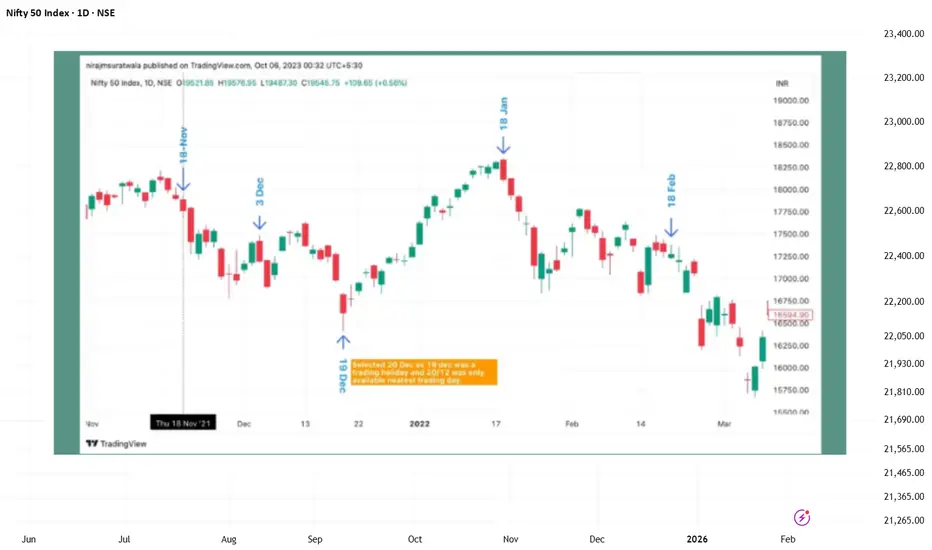
This idea is a historical and educational case study explaining how Gann Pressure Dates and Solar Calculations were observed on Nifty 50 during 2021–2022.
Rather than forecasting or predicting outcomes, the focus here is on how time-based levels are derived and interpreted.
🔭 Concept Explained (Educational)
📅 Nifty 50: 2021–22 Time Observation
In this historical example:
A significant swing high formed in October 2021
Solar time calculations highlighted multiple calendar dates
Several of these dates aligned with visible changes in market behaviour
These dates are often referred to as “Pressure Dates” — periods where volatility, trend change, or acceleration may occur.
🧠 How These Dates Are Interpreted
A simple observational framework used in Gann studies:
Allow the level candle to close
If the next session closes above the level candle’s high → strength may be present
If the next session closes below the level candle’s low → weakness may be present
If a date falls on a market holiday, the nearest trading session is observed instead
This approach encourages discipline and patience, rather than emotional reactions.
📌 Key Learning
Disclaimer:
This content is shared strictly for educational and analytical purposes only.
It does not constitute trading advice or future market prediction.
This idea is a historical and educational case study explaining how Gann Pressure Dates and Solar Calculations were observed on Nifty 50 during 2021–2022.
Rather than forecasting or predicting outcomes, the focus here is on how time-based levels are derived and interpreted.
🔭 Concept Explained (Educational)
- One component of Gann’s time analysis is Solar Calculation, where astronomical degrees are converted into market time.
- A commonly used conversion is:
- 365 days ÷ 360 degrees ≈ 1.014
- This factor is applied to key angular values such as:
- 30°
- 45°
- 60°
- 90°
- 120°
- When these time intervals are added to a major swing high or swing low, they often highlight dates where the market becomes time-sensitive.
📅 Nifty 50: 2021–22 Time Observation
In this historical example:
A significant swing high formed in October 2021
Solar time calculations highlighted multiple calendar dates
Several of these dates aligned with visible changes in market behaviour
These dates are often referred to as “Pressure Dates” — periods where volatility, trend change, or acceleration may occur.
🧠 How These Dates Are Interpreted
A simple observational framework used in Gann studies:
Allow the level candle to close
If the next session closes above the level candle’s high → strength may be present
If the next session closes below the level candle’s low → weakness may be present
If a date falls on a market holiday, the nearest trading session is observed instead
This approach encourages discipline and patience, rather than emotional reactions.
📌 Key Learning
- This case study highlights:
- The role of time symmetry in market structure
- Why Gann emphasised time before price
- How historical charts can be studied for repeatable behaviour
- Why time cycles should always be combined with price structure
Disclaimer:
This content is shared strictly for educational and analytical purposes only.
It does not constitute trading advice or future market prediction.

関連の投稿
免責事項
これらの情報および投稿は、TradingViewが提供または承認する金融、投資、取引、またはその他の種類の助言もしくは推奨であることを意図したものではなく、またこれらに該当するものでもありません。詳細は利用規約をご覧ください。
関連の投稿
免責事項
これらの情報および投稿は、TradingViewが提供または承認する金融、投資、取引、またはその他の種類の助言もしくは推奨であることを意図したものではなく、またこれらに該当するものでもありません。詳細は利用規約をご覧ください。