
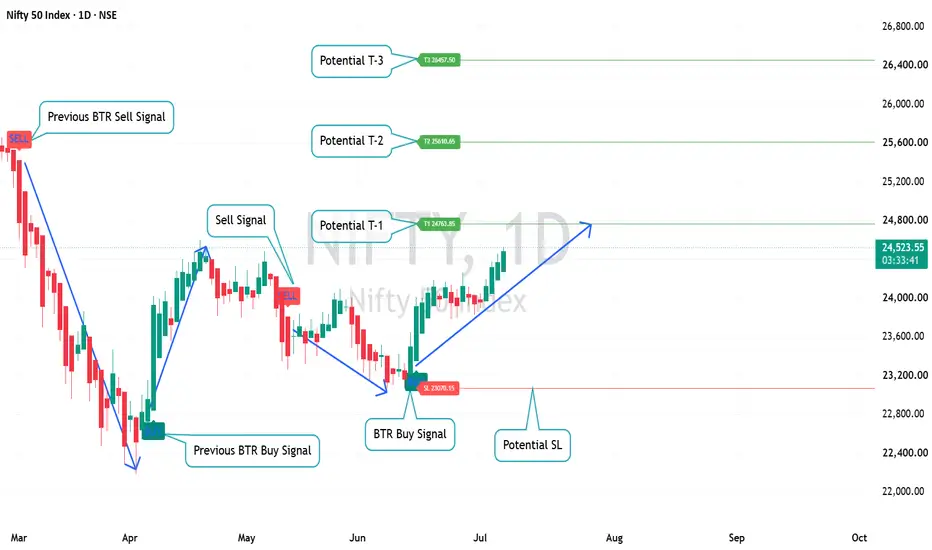
The daily chart continues to reflect a constructive trend after the recent recovery. The previous BTR Sell Signal captured the corrective phase, while the latest BTR Buy Signal marked the beginning of a fresh bullish swing.
Current market structure suggests that buyers remain in control as price continues to trade above the recent swing low and forms a sequence of higher highs and higher lows.
Key Observations
✅ Previous correction completed after the BTR Sell Signal.
✅ A fresh BTR Buy Signal indicates renewed bullish momentum.
✅ Price is approaching the first potential resistance zone.
Potential Price Levels
🎯 Potential T-1: 24,763.85
🎯 Potential T-2: 25,610.65
🎯 Potential T-3: 26,457.50
🛡️ Potential Risk Level (SL): 23,070.15
Investment Perspective
For short-term investors, the broader trend remains positive while the BTR Buy Signal stays valid. Instead of chasing price after a sharp rally, investors may consider waiting for healthy pullbacks or consolidation before adding fresh positions, always managing risk according to their investment plan.
Successful investing is not about predicting every move—it is about following a disciplined process with patience and proper risk management.
This post is for educational purposes only and reflects a technical market analysis using the BTR Price Action Framework. It is not investment advice or a recommendation to buy or sell any security.
Current market structure suggests that buyers remain in control as price continues to trade above the recent swing low and forms a sequence of higher highs and higher lows.
Key Observations
✅ Previous correction completed after the BTR Sell Signal.
✅ A fresh BTR Buy Signal indicates renewed bullish momentum.
✅ Price is approaching the first potential resistance zone.
Potential Price Levels
🎯 Potential T-1: 24,763.85
🎯 Potential T-2: 25,610.65
🎯 Potential T-3: 26,457.50
🛡️ Potential Risk Level (SL): 23,070.15
Investment Perspective
For short-term investors, the broader trend remains positive while the BTR Buy Signal stays valid. Instead of chasing price after a sharp rally, investors may consider waiting for healthy pullbacks or consolidation before adding fresh positions, always managing risk according to their investment plan.
Successful investing is not about predicting every move—it is about following a disciplined process with patience and proper risk management.
This post is for educational purposes only and reflects a technical market analysis using the BTR Price Action Framework. It is not investment advice or a recommendation to buy or sell any security.
トレード稼働中
Trade is active for long term analysis
関連の投稿
免責事項
これらの情報および投稿は、TradingViewが提供または承認する金融、投資、取引、またはその他の種類の助言もしくは推奨であることを意図したものではなく、またこれらに該当するものでもありません。詳細は利用規約をご覧ください。
免責事項
これらの情報および投稿は、TradingViewが提供または承認する金融、投資、取引、またはその他の種類の助言もしくは推奨であることを意図したものではなく、またこれらに該当するものでもありません。詳細は利用規約をご覧ください。