
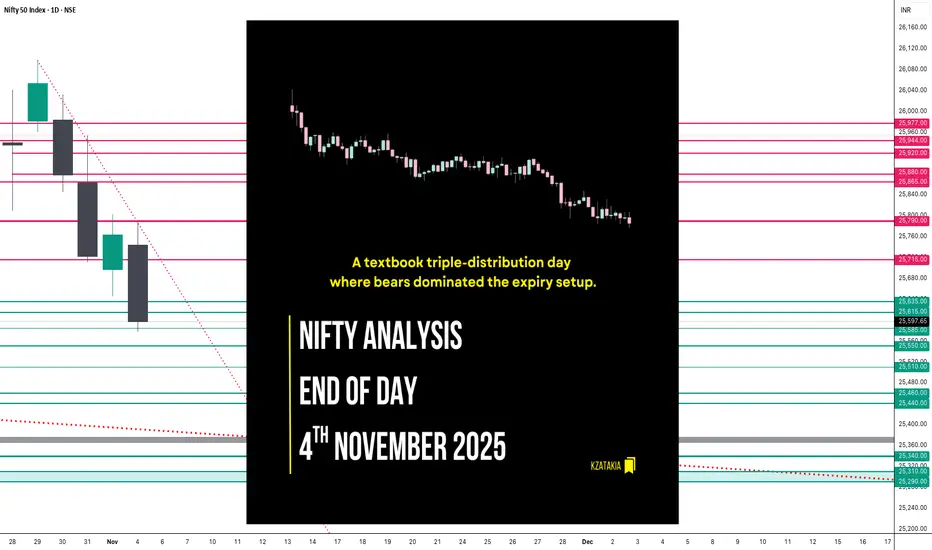
🟢 Nifty Analysis EOD – November 4, 2025 – Tuesday 🔴
A textbook triple-distribution day where bears dominated the expiry setup.
🗞 Nifty Summary
Nifty started flat to negative and instantly marked the day high at 25,787.40 in the very first minute. A sharp 82-point drop followed, taking the index to the crucial 25,706 zone. From there, Nifty got trapped within a narrow 35-point range (25,720–25,685) before slipping into another similar micro-range (25,685–25,650).
The entire day was a grind dominated by bears while bulls fought to defend supports — often leading to both-side fakeouts that punished intraday traders, particularly option buyers during weekly expiry volatility.
Around 2 PM, a breakdown from the second range breached both the PDL and the 25,635–25,615 support zone with strong momentum and volatility. The index eventually closed at 25,597.65, right at support and near the day’s low — confirming a triple-distribution day structure and a decisive bearish tone.
The engulfing move of yesterday’s bullish candle indicates that bears still have control, and short-term retracement toward 25,400 remains likely.
🛡 5 Min Intraday Chart with Levels

📉 Daily Time Frame Chart with Intraday Levels

🕯 Daily Candle Breakdown
Open: 25,744.75
High: 25,787.40
Low: 25,578.40
Close: 25,597.65
Change: −165.70 (−0.64%)
🏗️ Structure Breakdown
Type: Large bearish candle with a long body and small upper wick.
Range (High–Low): 209 points → high volatility session.
Body: ≈ 147 points → strong bearish control throughout.
Upper Wick: ≈ 42.65 points → rejection from 25,780 resistance.
Lower Wick: ≈ 19.25 points → weak late-session buying attempt.
📚 Interpretation
Nifty opened weak and failed to sustain above 25,780, triggering heavy selling below 25,650. This breakdown invalidated short-term bullish attempts, with bears pressing the index below major supports.
Despite minor pullbacks, the structure clearly confirms downtrend continuation with momentum building toward 25,400.
🕯Candle Type
A strong bearish continuation candle, confirming that yesterday’s spinning-top pattern was merely a pause before another leg lower.
🛡 5 Min Intraday Chart

⚔️ Gladiator Strategy Update
ATR: 202.64
IB Range: 102.30 → Medium
Market Structure: Balanced
Trade Highlights:
10:17 – Short Trade → SL Hit
11:25 – Long Trade → Trailing SL Hit
14:10 – Short Trade → Trailing SL Hit
📌 What’s Next? / Bias Direction
Trend : Bearish Continuation
If this momentum persists, short-term retracement toward 25,400 seems likely. Immediate supports lie at 25,550 and 25,460–25,440 zones.
📌 Support & Resistance Levels
Resistance Zones:
25,715
25,790
25,865 ~ 25,880
Support Zones:
25,585
25,550
25,510
25,460 ~ 25,440
💡 Final Thoughts
A clean triple-distribution expiry session often defines trend continuation phases rather than reversals. As long as Nifty remains below 25,700, sellers will dominate. A break below 25,550 could extend the fall to 25,400 — while any sustained move above 25,715 may only bring temporary relief.
“The market rewards patience when chaos tests conviction.”
✏️ Disclaimer
This is just my personal viewpoint. Always consult your financial advisor before taking any action.
A textbook triple-distribution day where bears dominated the expiry setup.
🗞 Nifty Summary
Nifty started flat to negative and instantly marked the day high at 25,787.40 in the very first minute. A sharp 82-point drop followed, taking the index to the crucial 25,706 zone. From there, Nifty got trapped within a narrow 35-point range (25,720–25,685) before slipping into another similar micro-range (25,685–25,650).
The entire day was a grind dominated by bears while bulls fought to defend supports — often leading to both-side fakeouts that punished intraday traders, particularly option buyers during weekly expiry volatility.
Around 2 PM, a breakdown from the second range breached both the PDL and the 25,635–25,615 support zone with strong momentum and volatility. The index eventually closed at 25,597.65, right at support and near the day’s low — confirming a triple-distribution day structure and a decisive bearish tone.
The engulfing move of yesterday’s bullish candle indicates that bears still have control, and short-term retracement toward 25,400 remains likely.
🛡 5 Min Intraday Chart with Levels
📉 Daily Time Frame Chart with Intraday Levels
🕯 Daily Candle Breakdown
Open: 25,744.75
High: 25,787.40
Low: 25,578.40
Close: 25,597.65
Change: −165.70 (−0.64%)
🏗️ Structure Breakdown
Type: Large bearish candle with a long body and small upper wick.
Range (High–Low): 209 points → high volatility session.
Body: ≈ 147 points → strong bearish control throughout.
Upper Wick: ≈ 42.65 points → rejection from 25,780 resistance.
Lower Wick: ≈ 19.25 points → weak late-session buying attempt.
📚 Interpretation
Nifty opened weak and failed to sustain above 25,780, triggering heavy selling below 25,650. This breakdown invalidated short-term bullish attempts, with bears pressing the index below major supports.
Despite minor pullbacks, the structure clearly confirms downtrend continuation with momentum building toward 25,400.
🕯Candle Type
A strong bearish continuation candle, confirming that yesterday’s spinning-top pattern was merely a pause before another leg lower.
🛡 5 Min Intraday Chart
⚔️ Gladiator Strategy Update
ATR: 202.64
IB Range: 102.30 → Medium
Market Structure: Balanced
Trade Highlights:
10:17 – Short Trade → SL Hit
11:25 – Long Trade → Trailing SL Hit
14:10 – Short Trade → Trailing SL Hit
📌 What’s Next? / Bias Direction
Trend : Bearish Continuation
If this momentum persists, short-term retracement toward 25,400 seems likely. Immediate supports lie at 25,550 and 25,460–25,440 zones.
📌 Support & Resistance Levels
Resistance Zones:
25,715
25,790
25,865 ~ 25,880
Support Zones:
25,585
25,550
25,510
25,460 ~ 25,440
💡 Final Thoughts
A clean triple-distribution expiry session often defines trend continuation phases rather than reversals. As long as Nifty remains below 25,700, sellers will dominate. A break below 25,550 could extend the fall to 25,400 — while any sustained move above 25,715 may only bring temporary relief.
“The market rewards patience when chaos tests conviction.”
✏️ Disclaimer
This is just my personal viewpoint. Always consult your financial advisor before taking any action.

Read my blogs here:
substack.com/@kzatakia
Follow me on Telegram:
t.me/swingtraderhub
Follow me on X:
x.com/kzatakia
substack.com/@kzatakia
Follow me on Telegram:
t.me/swingtraderhub
Follow me on X:
x.com/kzatakia
関連の投稿
免責事項
これらの情報および投稿は、TradingViewが提供または承認する金融、投資、取引、またはその他の種類の助言もしくは推奨であることを意図したものではなく、またこれらに該当するものでもありません。詳細は利用規約をご覧ください。
Read my blogs here:
substack.com/@kzatakia
Follow me on Telegram:
t.me/swingtraderhub
Follow me on X:
x.com/kzatakia
substack.com/@kzatakia
Follow me on Telegram:
t.me/swingtraderhub
Follow me on X:
x.com/kzatakia
関連の投稿
免責事項
これらの情報および投稿は、TradingViewが提供または承認する金融、投資、取引、またはその他の種類の助言もしくは推奨であることを意図したものではなく、またこれらに該当するものでもありません。詳細は利用規約をご覧ください。