
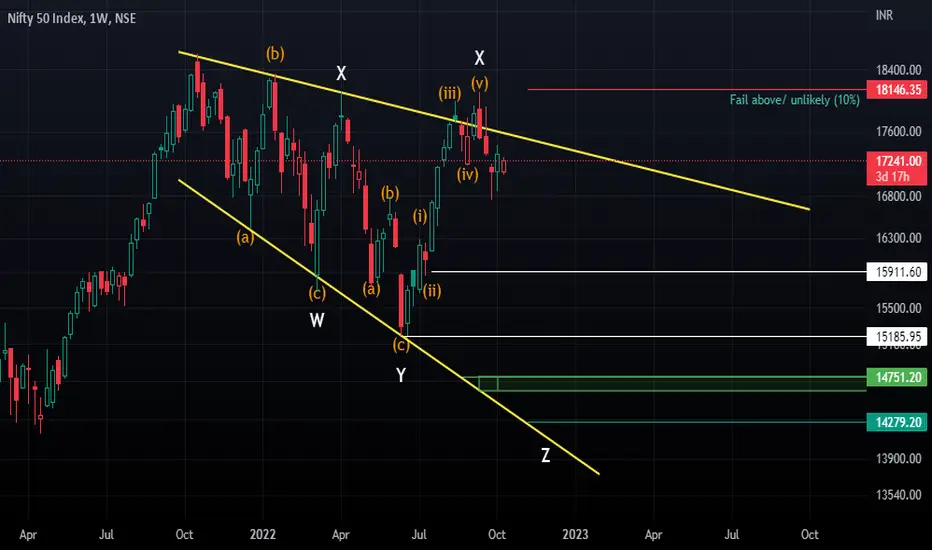
TZ is what I see looking at this chart
above the last height, it fails + means it was DZ (wxy), and the previous bounce(X2) is the beginning of the Bullrun which is not
the main target is the green box
above the last height, it fails + means it was DZ (wxy), and the previous bounce(X2) is the beginning of the Bullrun which is not
the main target is the green box
ノート
the chart is still active but the X2 wave numbering is incorrect
関連の投稿
免責事項
これらの情報および投稿は、TradingViewが提供または承認する金融、投資、取引、またはその他の種類の助言もしくは推奨であることを意図したものではなく、またこれらに該当するものでもありません。詳細は利用規約をご覧ください。
関連の投稿
免責事項
これらの情報および投稿は、TradingViewが提供または承認する金融、投資、取引、またはその他の種類の助言もしくは推奨であることを意図したものではなく、またこれらに該当するものでもありません。詳細は利用規約をご覧ください。