
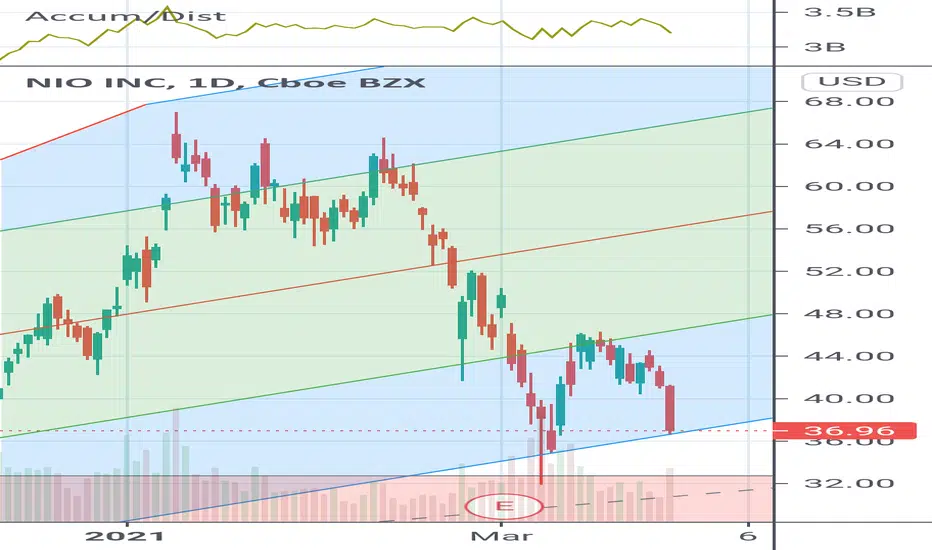
Had this chart done months ago and was using it to find my buys and sell zones. Please stop listening to bear posts as they are mostly there to create fud. Based on about 60 trades I have made 70% have been positive based on this chart. I also own a substantial number of shares for a longterm trade.
You would also notice that bearish charts have started popping left right and centrw so please do your own DD and trade based on your knowledge.
1. Chip shortage is affecting every tech company
2. Growth stocks are being beaten down
So plan your trades and get away from the noise. I am extremely bullish mid and long term.
You would also notice that bearish charts have started popping left right and centrw so please do your own DD and trade based on your knowledge.
1. Chip shortage is affecting every tech company
2. Growth stocks are being beaten down
So plan your trades and get away from the noise. I am extremely bullish mid and long term.
トレード稼働中
As noted my lines held up pretty well.
免責事項
これらの情報および投稿は、TradingViewが提供または承認する金融、投資、取引、またはその他の種類の助言もしくは推奨であることを意図したものではなく、またこれらに該当するものでもありません。詳細は利用規約をご覧ください。
免責事項
これらの情報および投稿は、TradingViewが提供または承認する金融、投資、取引、またはその他の種類の助言もしくは推奨であることを意図したものではなく、またこれらに該当するものでもありません。詳細は利用規約をご覧ください。