
RedKTrader のその他の限定インジケーター
月額$49.99で The RedKTrader Pro Toolbox を購読すると、このクリエイターの限定インジケーターを入手できます。お支払いはTradingView上で完結し、すぐにチャート上で利用できます。
The RedKTrader Pro Toolbox を見る* this is a pure chart reading (analysis) for NKLA and expected scenarios based on price and volume action and what the indicators tell us - has nothing to do with the fundamentals or how the business itself is doing.
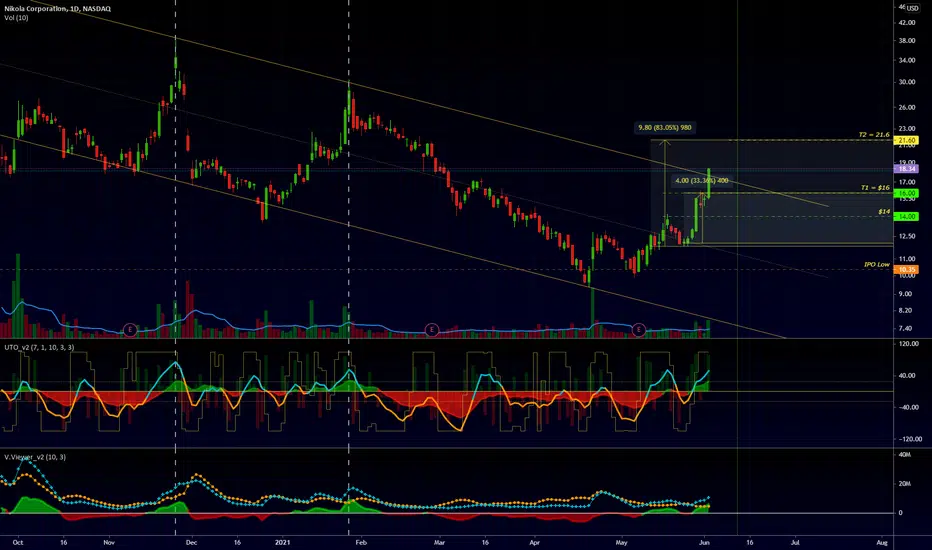
Daily Chart:
- NKLA has accelerated in the past few days with (couple of days showing) large % moves supported by big volume (almost 2x daily avg)
- NKLA has been moving within a steady channel for the past few months
- in this channel, this will be the 6th attempt to break the upper channel line
- indicators showing a move to the bullish side for momentum, sentiment and net volume - but that has already happened in all the prior breakout attempts - doesn't really mean a big deal
Price Projections:
- measured move (based on price structure) target #1 was $16 - which was hit last week.
we see how the action hesitated once that target was hit
- The next measured move goes up to ~ $21.6 -- that's 22% from where we closed today (Wed June 2nd) - that's our scenario #1
- is this target too far: given the recent big moves, and how NKLA accelerated towards the $16, it can take only 2 "big days" to get to that next target
--- *BUT* if we look at the prior breakout attempts, that move may fail - it really depends on how the bulls act at this level, and if more buyers continue to come in more that those who are shorting or cashing out .. so scenario #2 is that NKLA goes back into the channel
the good news in both scenarios, is that some action is happening - it seems many traders got stuck with NKLA and were considering it a "loser"
weekly chart:
- the weekly shows that the "weakness is fading" - rather than "strength is increasing" - so we're not really in bull territory yet -- may get there if the strength continues for couple more weeks
- the weekly chart does a better job in showing the priori breakout attempts

Active positions in NKLA will need to be watched very closely and managed carefully.. this is a very volatile landscape.
good luck!
Daily Chart:
- NKLA has accelerated in the past few days with (couple of days showing) large % moves supported by big volume (almost 2x daily avg)
- NKLA has been moving within a steady channel for the past few months
- in this channel, this will be the 6th attempt to break the upper channel line
- indicators showing a move to the bullish side for momentum, sentiment and net volume - but that has already happened in all the prior breakout attempts - doesn't really mean a big deal
Price Projections:
- measured move (based on price structure) target #1 was $16 - which was hit last week.
we see how the action hesitated once that target was hit
- The next measured move goes up to ~ $21.6 -- that's 22% from where we closed today (Wed June 2nd) - that's our scenario #1
- is this target too far: given the recent big moves, and how NKLA accelerated towards the $16, it can take only 2 "big days" to get to that next target
--- *BUT* if we look at the prior breakout attempts, that move may fail - it really depends on how the bulls act at this level, and if more buyers continue to come in more that those who are shorting or cashing out .. so scenario #2 is that NKLA goes back into the channel
the good news in both scenarios, is that some action is happening - it seems many traders got stuck with NKLA and were considering it a "loser"
weekly chart:
- the weekly shows that the "weakness is fading" - rather than "strength is increasing" - so we're not really in bull territory yet -- may get there if the strength continues for couple more weeks
- the weekly chart does a better job in showing the priori breakout attempts
Active positions in NKLA will need to be watched very closely and managed carefully.. this is a very volatile landscape.
good luck!
ノート
should we expect a pop now that NKLA is about to be added to the Russel 3000 ?? this is going to happen end of this week and may drive some increased demand on the stock
🌐 RedKTrader.com/
"Understand the market. Trade your way."
TA Research & Coaching.
Pro tools on classic TA: EVEREX · VADER · TPX · VARSI · CoRA WAve
Tri-View MTF system & TACT Coaching Series
𝕏: @RedKTrader
"Understand the market. Trade your way."
TA Research & Coaching.
Pro tools on classic TA: EVEREX · VADER · TPX · VARSI · CoRA WAve
Tri-View MTF system & TACT Coaching Series
𝕏: @RedKTrader
免責事項
これらの情報および投稿は、TradingViewが提供または承認する金融、投資、取引、またはその他の種類の助言もしくは推奨であることを意図したものではなく、またこれらに該当するものでもありません。詳細は利用規約をご覧ください。
🌐 RedKTrader.com/
"Understand the market. Trade your way."
TA Research & Coaching.
Pro tools on classic TA: EVEREX · VADER · TPX · VARSI · CoRA WAve
Tri-View MTF system & TACT Coaching Series
𝕏: @RedKTrader
"Understand the market. Trade your way."
TA Research & Coaching.
Pro tools on classic TA: EVEREX · VADER · TPX · VARSI · CoRA WAve
Tri-View MTF system & TACT Coaching Series
𝕏: @RedKTrader
免責事項
これらの情報および投稿は、TradingViewが提供または承認する金融、投資、取引、またはその他の種類の助言もしくは推奨であることを意図したものではなく、またこれらに該当するものでもありません。詳細は利用規約をご覧ください。