
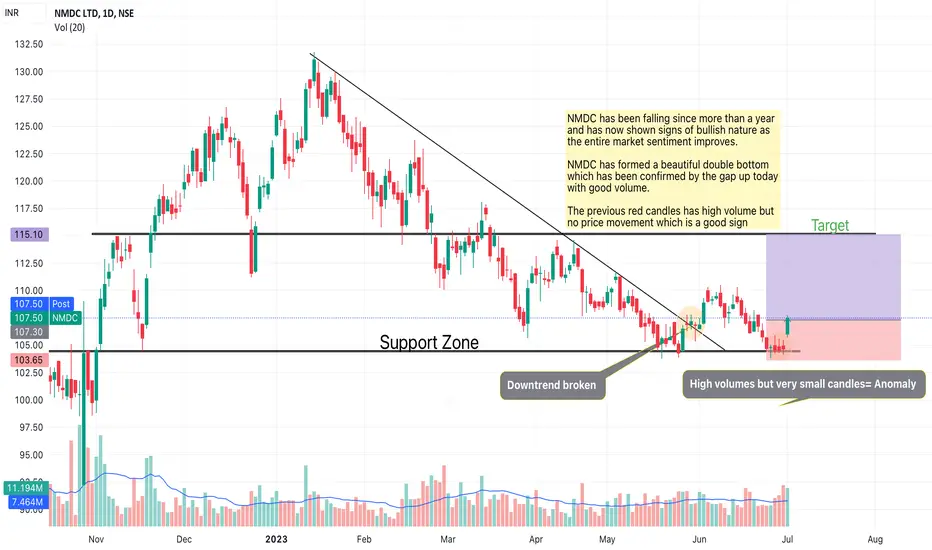
NMDC has been falling since more than a year and has now shown signs of bullish nature as the entire market sentiment improves.
NMDC has formed a beautiful double bottom which has been confirmed by the gap up today with good volume. The previous red candles has high volume but no price movement which is a good sign and shows lack of selling pressure.
NMDC weekly chart is also forming a inverted head and shoulders pattern
As the market breaks all time highs and seeks new levels, some stock have not contributed to the previous rally such as reliance and Infosys but these stocks went at very good levels currently. A stock like NMDC is showing a good double bottom and a beautiful risk to reward.
Target: Short term as of chart
Stop loss: Below recent low and support zone
Keep It Simple
NMDC has formed a beautiful double bottom which has been confirmed by the gap up today with good volume. The previous red candles has high volume but no price movement which is a good sign and shows lack of selling pressure.
NMDC weekly chart is also forming a inverted head and shoulders pattern
As the market breaks all time highs and seeks new levels, some stock have not contributed to the previous rally such as reliance and Infosys but these stocks went at very good levels currently. A stock like NMDC is showing a good double bottom and a beautiful risk to reward.
Target: Short term as of chart
Stop loss: Below recent low and support zone
Keep It Simple
ノート
Slight low volume consolidation which is normalノート
Amazing green candle with huge volume has been formed.. stay strongノート
Trade is going well.. stay with itノート
Target about to hit.. be readyノート
Target achieved.. good work
免責事項
これらの情報および投稿は、TradingViewが提供または承認する金融、投資、取引、またはその他の種類の助言もしくは推奨であることを意図したものではなく、またこれらに該当するものでもありません。詳細は利用規約をご覧ください。
免責事項
これらの情報および投稿は、TradingViewが提供または承認する金融、投資、取引、またはその他の種類の助言もしくは推奨であることを意図したものではなく、またこれらに該当するものでもありません。詳細は利用規約をご覧ください。