 NNDM
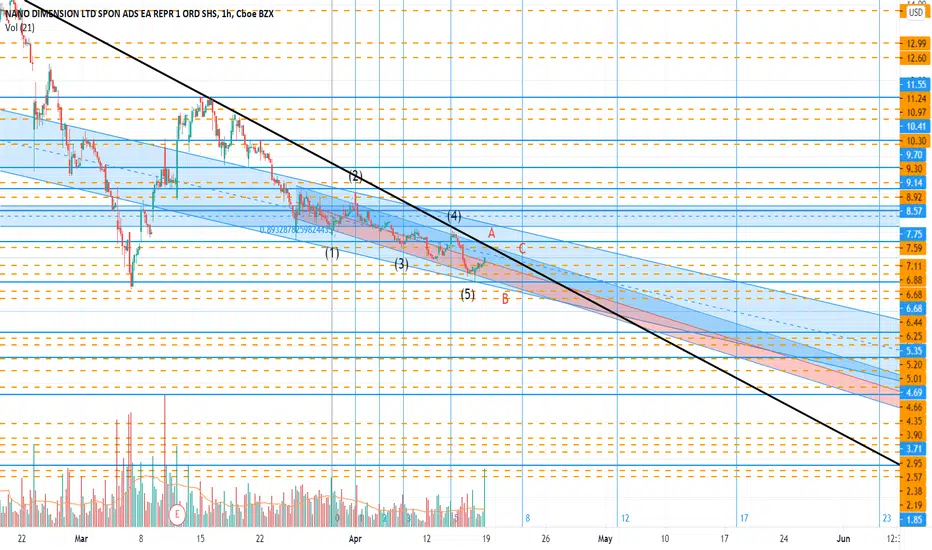
NNDMOn 16th April, the price action was bullish with a spike in the traded volume. Now I can't say for sure, but if it breaks the resistance shown with the black line at points A or C, the bullish reversal may be on the way real soon. But if it breaks the support at $6.68 at point B and $6.27 (orange dashed line), the next support will be at $5.35. So I guess we just have to wait and see how it will all play out.
This is not in any way financial advice.
*The solid blue lines are Fib retracement lines
**The dashed orange lines are Volume profile

免責事項
これらの情報および投稿は、TradingViewが提供または承認する金融、投資、取引、またはその他の種類の助言もしくは推奨であることを意図したものではなく、またこれらに該当するものでもありません。詳細は利用規約をご覧ください。
免責事項
これらの情報および投稿は、TradingViewが提供または承認する金融、投資、取引、またはその他の種類の助言もしくは推奨であることを意図したものではなく、またこれらに該当するものでもありません。詳細は利用規約をご覧ください。