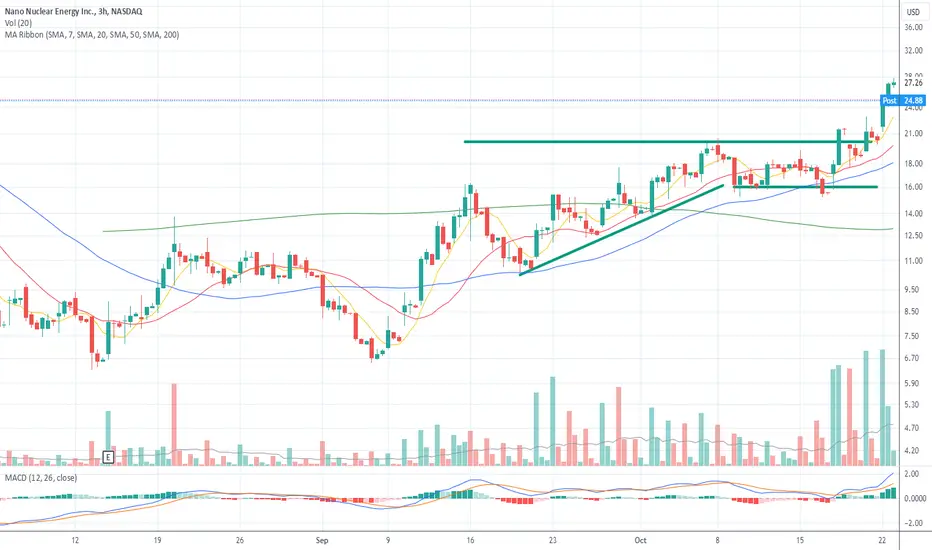
 NNE Graph illustration in practice:
It's not very clean when there is high volatility, but the principle remains the same.
First bullish leg of more than 30% (here +100%), higher lows, volatility contraction, price riding the moving averages (-> the Fork Toto), formation of a tight base -> pattern like RDM or VCP 🔥🔥
The difference between a pattern that works and one that doesn't lies in what fuels it.
We observe this with a change in volume behavior: large buyer volumes and low seller volumes.
In this case, the fuel is investors' interest in new AI technology.

免責事項
これらの情報および投稿は、TradingViewが提供または承認する金融、投資、取引、またはその他の種類の助言もしくは推奨であることを意図したものではなく、またこれらに該当するものでもありません。詳細は利用規約をご覧ください。
免責事項
これらの情報および投稿は、TradingViewが提供または承認する金融、投資、取引、またはその他の種類の助言もしくは推奨であることを意図したものではなく、またこれらに該当するものでもありません。詳細は利用規約をご覧ください。