
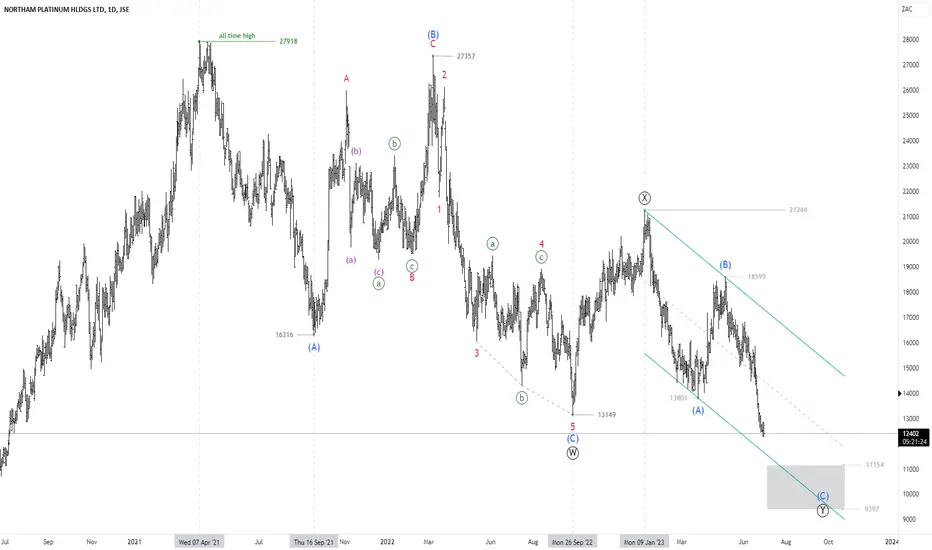
Northam is down 56% from its all time high.
This bear market is over two years in the making and looks to be unfolding as a double zigzag.
The first zigzag, ((W)) is much bigger in price and time than the current zigzag for ((Y)) which is not against the rules and guidelines.
Focusing on ((Y)), the stock looks to be in the wave (C) which is approaching key price levels.
Using Fibonacci extension guidelines, 11154 to 9397 represents the price zone where wave (C) is equal to and 1.236*greater than wave (A) and confluences with the lower support line of the channel.
Short the rallies into this confluence zone.
This bear market is over two years in the making and looks to be unfolding as a double zigzag.
The first zigzag, ((W)) is much bigger in price and time than the current zigzag for ((Y)) which is not against the rules and guidelines.
Focusing on ((Y)), the stock looks to be in the wave (C) which is approaching key price levels.
Using Fibonacci extension guidelines, 11154 to 9397 represents the price zone where wave (C) is equal to and 1.236*greater than wave (A) and confluences with the lower support line of the channel.
Short the rallies into this confluence zone.

免責事項
これらの情報および投稿は、TradingViewが提供または承認する金融、投資、取引、またはその他の種類の助言もしくは推奨であることを意図したものではなく、またこれらに該当するものでもありません。詳細は利用規約をご覧ください。
免責事項
これらの情報および投稿は、TradingViewが提供または承認する金融、投資、取引、またはその他の種類の助言もしくは推奨であることを意図したものではなく、またこれらに該当するものでもありません。詳細は利用規約をご覧ください。